Detailed Topic Index

Thursday, May 24, 2018

Conventional vs Low load Lifting - Risks and Benefits

After 1 year of working with muscle O2 monitoring, low and conventional load weight training, I have come up with a number of observations.  This post will summarize some of them as well as present a warning to those lifters wanting to get back to heavy lifting again.  Like everything in training, each technique has its advantages and disadvantages.
Firstly, many studies have shown that for the most part, lower load lifting can achieve similar muscle mass gains compared to more conventional type loads.  We will see in a bit that some tweaking of your workout may be needed to succeed in this, but it can be done.  However it is pretty universally agreed that low load lifting can not produce the same peak strength seen with heavy lifts.  This makes perfect sense from the specificity standpoint, if you train very heavy, you will excel in peak strength, if you work on "endurance", strength will be less but rep counts will be higher.  As we will see shortly, there may be real medical dangers in resuming heavy loads particularly in the shoulder.  Even though it may be a major letdown to never lift heavy again, you are better off lifting something and maintaining muscle mass, than having repeat shoulder surgery.  I am reminded of a patient who was a power lifter and was unwilling to reduce his weights despite 2 failed rotator cuff repairs.
On the other hand, there may be real benefits (besides more power) from conventional lifting which we will look at from the NIRS perspective.  If some of this can be safely incorporated  into your routine, I would strongly recommend doing so.

Lets first look at the desaturation patterns of a few exercises to better understand the difference between low and high loads.  The first difference is that a high load by virtue of more severe external compression of the vascular compartment, will cause more profound O2 desaturation.

Here is a tracing of the Row, Dip and Pulldown all done at about a 10 RM load:
As noted, the desaturation is impressive, measured on the Lats, with sharp drops in total Hb, indicating excellent compressive force from the muscular contraction.

Compare the above to doing the row with the sensor on the lats but comparing 80 vs 110 lbs(each side).  The 80 is the low load weight, 110 is my 10 RM:
So the first 2 sets have minimal desaturation but an excellent drop in both O2 and THb when lifting heavier.
I had another sensor on a slightly different area of the lats when doing the above 3 sets shown below:
Although the desaturation with the low load is better, it is still way below the heavier load.
However another good example of the heterogeneous nature of muscle O2 kinetics.

Conclusions so far:
  • Heavier loads will lead to lower desaturations in general.
  • Heavier loads will affect more areas of the muscle intended to be exercised.

What about heavier weights perhaps causing desaturations in muscle groups not typically targeted by a particular exercise.
Here is a good example.  The exercise is a pulldown which typically targets the lats, biceps, forearms.  However, at higher weight, a very good desaturation occurs on the chest (similar to a chest press).  In this instance, the low load dropped O2 very well on the lats on both high and low weight attempts.  But the low load did not have the overlapping effects on the chest seen with the higher weights.
Another example of this is the posterior deltoid/fly exercise.
Typically this targets the rear portion of the deltoid, but as seen above should have some effect on the lats and upper back muscles.
This is a tracing of the above machine using either 30 lbs or 40 lbs, sensors on the deltoid and lats:
Only the heavy weight has a significant effect on the lat muscle desaturation.

In summary, heavier weights will potentially target more areas leading to more training sets per muscle group.

Having said all this, why even bother with lower weights?  
The following paper is an important counterpoint to the attempt to train with heavier weights if you have rotator cuff impingement, partial tears or other pathology.  Two groups were compared, a normal shoulder group and another with typical impingement symptoms.  External rotation and abduction exercises were done with supraspinatus tendon measurements taken before and at times after.  It was shown that in the symptomatic shoulder group, tendon thickness did increase thereby causing possible further subacromial space reduction and more impingement.

 
 This was the conclusion of the paper:
This certainly gives us some concern about pushing heavier weights with already underlying rotator cuff pathology.  The situation is not going to resolve spontaneously and is possibly why it is so difficult to come back from shoulder injuries.  According to other studies, other tendons (Achilles with pathology) may also swell under load.  However, in this case the swelling leads to further structural tearing and damage.


Where does this leave us?
Conventional load lifting will produce lower desaturations than low loads.  More muscles, both in the same and distant groups will be targeted by conventional training.  But, if the lifter has rotator cuff impingement, heavier loads will lead to further space narrowing and tendon damage.
What I have been doing lately is a hybrid approach.  On days when I am lifting light, I will finish with one set of 10 RM weight, except in exercises targeting the rotator cuffs (any previous exercise that caused pain in that area).  So instead of 3 sets of low load (usually a reverse drop set), the last set will be a 10 RM load.  Note, in the reverse drop set method, the last set was at a higher weight anyway, in this case it is just boosted further.

For exercises that load the rotator cuff tendons, only low load variations are done and no attempt at weight progression will be done.


Monday, May 21, 2018

XC skiing - Pitfalls and opportunities in O2 monitoring

As seen in the last post, the sport of cross country skiing creates complex choices for the distribution of finite cardiac resources.  Since so many muscle groups are involved, the O2 saturation monitoring of any one area can potentially misrepresent the status of overall systemic energy reserves.  Again we are at a disadvantage in that so little data has been published looking at the normal physiology of O2 desaturation, let alone how to best leverage this to improve performance.  To start the discussion off, I would like to show some more data from our friend XCSkier, illustrating the basic problems with simplistic models of O2 desaturation.

Here is an interval done rollerskiing, with sensors on the RF and VL.
The desat curves are quite different, making usage in a real time or even retrospective nature confusing.

As noted above, the VL drops quickly and slowly rises (despite HR increase) but the RF drops more slowly and stays down.  A study did indicate that there may be inherent differences to how O2 transport occurs in each muscle group:
Interestingly, my RF and VL during cycling have similar responses:


Another test done by XCSkier was a "515" protocol (run) advocated my the Moxy people (note that this protocol is not done routinely in the majority of published studies).  Again we have 2 sensors, chest and VL:
The chest in gray does have a relatively smooth decline through the efforts.  The VL though is more complex, note the orange lines drawn to show O2 desat trending within each interval.
In addition, the more intense efforts did not have a step wise drop between them before the plateau at the end:
Circled in blue are the O2 curves and despite the HR progressively rising, the third to last was perhaps even higher than the one before it.  Finally, the yellow marker is a 15 sec sprint, indicating the potential ability to have severe desaturation at both sites.  This potential was not reached in the 515 test.

My points are:
Different muscles behave differently.
Be cautious in interpreting atypical ramp testing protocols.


Rollerskiing triceps(#1) vs chest(#2) (costal like):

According to XCSkier:
1. Easy  (the same as before)
2. Hard  (the same as before)
3. About 15 minutes uphill (until 24:00 at or just below threshold, feeling good)
and then I pushed hard until 25:50 or so. I could go maybe another 30sec
at that pace.
4. Continued skiing at decent pace, but slowed down for about a 1:15. Heart
rate didn't go down much, but not feeling too bad.
5. Very hard -- all out for a minute (until 28:20), couldn't continue.
6. Active rest (skiing very slow, but moving) until 31:04
7. Very hard for another minute, couldn't continue.


First the triceps - circle in yellow- triceps desat with drop in THb, just like in we saw in my old weight training posts.  Muscle force causes external compression and Hb drop
Second yellow, hard effort but since he was tired (or more vasodilated at that spot), no drop in Hb.
The fact that Hb rises may indicate some venous outflow obstruction from mild compression.
Lastly, in orange, hard effort until failure(just 1 min and was exhausted) - there was good resaturation before (so he should have been "ready") but no Hb drop during(muscles tired-lack of force and vasodilated)
Great example for the inability of NIRS to take fatigue (muscle and central) into account, as well as not being useful for "readiness for next interval".


Looking at the chest (surrogate for costal):
Early 2 intervals, the O2 desat is there and the Hb pattern looks like venous outflow obstruction (but mild and possibly of no significance).  Harder interval #2 has a lower O2 reached more quickly.
Later intervals of higher intensity:
There is much more variation during the long interval.  The heart rate is slowly rising and one wonders if the effort was leading to more of a global impact than thought.  Some desats near 15%!
The last 1 min(orange) all out leads to the largest desat of the course and is way lower than the triceps which is an active muscle - nice proof of concept in looking at this area as a better index of systemic homeostasis.


The above tracings indicate substantial involvement of the triceps with excellent desats but chest monitoring probably is a better marker of overall physiologic status.  Just because a muscle has regained normal O2 levels does not in any way indicate you are ready to engage high intensity efforts again.


The saturation of active muscles is not always an accurate marker of effort, pace or readiness.  Addressing that issue has been my focus lately and the following are some of the latest opportunities in O2 monitoring.
Two goals, one to validate costal O2 as a realtime guide to race pacing.  The other to find another surrogate that tracks closely but at a site more practical for larger sensors than the BSX.

First question:  Is looking at the O2 tracing when doing a cycling effort on the road a valid way to maximize power?
The following two tracings were done on different days, well rested on the same course.
The first is looking at costal and RF O2 at a power slightly above what I would consider steady state.  Note the first 5 minutes are relatively stable but only on longer duration do the curves drop. Could this be respiratory threshold effects from acidosis and increasing respiratory rate/work of breathing?


Next is the same course at a slightly lower power:
Despite being of longer duration, the curves are relatively flat and within my stable zone (to follow).  This also partly answers question #2, the deltoid area did track very well with no anomalous behavior.  This power range would be most appropriate for longer intervals as well as time trials.

Also in regards to alternate site tracking is a comparison of chest and costal.
This was looking at the RF/costal:
They both track downward and have similar dynamic ranges.
Note also that this power range would not be suitable for longer duration efforts, as the O2 desat would eventually cross into the non sustainable range

Let's look at site comparison in more detail in short 60 sec maximal bouts.
The following are 1 min max efforts.
Both deltoid and costal desat quickly and to a similar degree.
Note that there is minimal resaturation after the intense effort while cycling at very low power.  This is probably a result of both continued blood distribution away from the costal/deltoid area as well as respiratory muscle use (costal) during rapid breathing.
The comparison of chest and deltoid was slightly different:
Chest desat was a bit slower and recovered later.  What is the significance and reproduce-ability in other subjects is certainly unclear.  The continued desat of the chest could be related to the persistence of high respiratory rate after the supra maximal effort, leading to continued chest muscular activity and higher O2 consumption than the deltoid.
This delayed nadir in chest desaturation was also seen on another day comparing chest vs costal:
It seems reproducible and I am including the data for those out there who are using this site.


One pitfall of the deltoid though.  This is a tracing of simply lifting the arm with no weight at the end of a ride.  Activities with arm motion(running?) are probably not totally reliable for deltoid monitoring:
 
Finally a word about doing this outside.  All of my data is done in the field (not on a trainer).
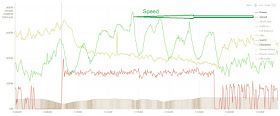
Below is a sample of speed and terrain variation during a long interval of 10 min.  I mention this for those of you who either don't like to train indoors, are considering using this in real race situations or use in other sports (XC skiing) where you must be outside.
As shown below, the speed difference is huge at times but the power and O2 sat remain very steady.


Summing up
  • Monitoring active muscles may be misleading (but not inaccurate) although some sites may mirror local and systemic status reasonably well.
  • Active muscles may have very different O2 kinetic profiles. 
  • The 515 test method has no published validation (that I can see).
  • Consider longer intervals slightly above and below your lactate threshold for fine tuning
  • Both costal, deltoid and chest are practical sites to guide steady state power and optimal efforts in time trialing.  The chest site may have a slight delay in nadir O2 levels on a short supra maximal effort.  The deltoid can be affected by arm motion.

Saturday, May 12, 2018

XC Skiing from the NIRS perspective

One of the most metabolically intense, cardiovascular demanding activities is the sport of cross country skiing.  The athlete is using upper body, trunk, abs for propulsion while poling with continuing leg motion with the skis.  To some extent it is the perfect storm for cardiac output redistribution since there really is no safe muscular site to withhold blood flow to.  Extreme VO2 maxs, high respiratory flows have historically been recorded which is not surprising.  Although there is some NIRS data published during a XC ski session, there has not been very much.  I recently was fortunate enough to view an athletes data and although there are perhaps more questions than answers, the results are fascinating. I would like to thank "XCSkier" for sharing his data and especially educating me about the sport.

First off, for those who are not familiar with the sport, there are several permutations to training.  There is a classic, skating and poling variety.  The poling involves using the arms, trunk to "push" along especially uphill.  The double poling up a hill leads to intense muscular demands since upper and lower body are working hard.  


Let's look at the literature first and see what has been published with respect to muscle O2 monitoring.  I think the most appropriate paper was done on British bi-athletes.
The 2 best members of the team were monitored over a course with sensors on the VL and triceps (Portamon).
And this is the NIRS data:
Despite the fact that each subject finished with virtually identical times, the desat/resat patterns have some differences.  But lets look at the 4 segments one by one.

Double poling/flat-arms only: Both subjects desat the triceps to a similar degree. Note the saw tooth pattern, is this related to each individual contraction?  No major changes to the legs.
Slight incline-arms and legs: Subject B has deeper desats to the legs than A, and looks like the triceps are more affected as well.  Less of a saw tooth pattern in B.  If this is related to single contractions, perhaps A is able to reperfuse better between strokes.
Downhill- no muscular effort/in tucked position:  Both subjects reperfuse the triceps well but for some reason A does not show a rebound in the legs.  The authors made some comments about the lack of resaturation in the downhill part of subject A:

There may be an alternate explanation.  If we look at the exertion immediately before the downhill, subject B had a desat of about -8% but subject A did not desat as much, about -4%.  Therefore not as much compensatory vaso dilatation would have been expected in subject A and he did not resaturate as much.  As has been shown elsewhere, the deeper the ischemia, the more pronounced the overshoot (subject B).

Steep incline- both arms and legs presumably more intense than the slight incline:
Subject B desaturates quicker, and deeper than A, also with similar elapsed times.  Whether this is related to stroke volume difference, efficiency, alternate muscle usage is unclear.
Regardless, it is interesting data and shows that we should be careful in how to interpret data and expect between subject variation in desaturation.


Let's now look at tracing of our friend XCSkier.  
A Moxy sensor was on the RF(1st sensor) and chest(2nd sensor), (same placement as recommended a few posts ago for respiratory muscle monitoring).
There are 4 intervals, 1,2,4 were easy, #3 intense(high heart rate):


The red is heart rate, green RF and background gray is chest.  There certainly is significant RF desat, bottoming out to zero on the hard section.  The chest results are definitely less prone to lack of low end dynamic range, they do get low but still have some range left.  When I originally looked at this, my guess was that the sensor was not reading accurately.  In sports such as running, cycling RF desat to zero is seldom seen.  However on further reading, XC skiing leads to the highest leg desats recorded.  Upper body desats are significant as well.  Nonetheless, if these figures are correct, this indicates that our friend probably would have difficulty keeping this pace for very long.  
Looking at segment #2, the heart rate is moderately high and the RF has a consistent downward drift, chest does desaturate but remains stable.


XCSkier then went on to do a lactate test on a treadmill.  This was his description and values:

It was a a continuous effort. Every 4 minutes or so, I jumped off
the treadmill to get my lactate values taken. The very last stage I only lasted about
a minute. So, I do get about 15s-20s break after every stage when the lactate sample was taken.

Lactate values were:
rest  1.39
1       1.25  (1:00)
2       1.21  (5:00)
3       1.40  (9:00)
4       1.90  (13:00)
5       2.61  (17:00)
6       4.25  (21:00)
7       7.41  (25:00)
8       8.40  (26:30)

So at about 21 minutes he is in the 4+ lactate range, which corresponds to the inflection points of the O2 desat curves in both RF and chest(ballpark estimate, no math involved):

Observations:
RF O2 sat does reach zero at the end of the test (without the competition from arm use in poling).  But with simultaneous arm and trunk competition, would the point have been different in terms of heart rate?
Lactate >4 occurs well before max heart rate.
RF rebound greater than chest O2 rebound 
Dips in RF at each pause for lactate sampling noted(?)

Next set up with a Moxy on the VL:
Five intervals:
1. Easy skating
2. Fast skating
3. Easy double poling
4. Fast double poling
5. Easy skating

And the Tot Hb, O2 sats:
I drew in the green lines showing the more rapid desats in the 2nd and 4th interval of Fasts.
The difference between the 2 Fast bouts was the rise in total Hb on the 4th, presumably from muscular compression of venous (not arterial) outflow.  This could mean more intense VL contractile force was present.

The competition for available blood flow and O2 supply between multiple active muscles and the respiratory system is complex.  Instead of the previous example of cycling legs vs costal readings, we are faced with leg vs arms/trunk/abs vs costal (respiratory) in a constantly changing mix of use case scenarios.  When reviewing this data and the subject of skiing, I was overwhelmed with the multitude of permutations that the athlete could employ to achieve the same end goal.  Some may use more upper vs lower body or perhaps be more efficient in either upper or lower body (and even not realize it).  
What we can say though is that if muscle O2 is continuing to drop to non sustainable levels, it is time to back off (or hope for a downhill).  The site chosen to best monitor these changes is unclear.  Do we look at the triceps, RF, VL or chest/costal.  I know for myself, in the case of cycling, I have had the "best" guidance with the costal location.  Unfortunately because of technical reasons the Moxy has trouble at that site and we used the lateral chest wall instead.  This area should have been minimally affected by poling but that is not proven.  Further testing, especially of longer times (>10-20 min continuous effort), which would best leverage the ability of the sensor to inform about exceeding lactate tolerance may be helpful.  For example, in my case, sensor usage would help me pace above my lactate steady state just long enough to get a distance gap, but not get into decompensating threshold difficulty.  Could that be useful here as well?  Conversely, in a 1 hour time trial (no power meters) of cross country skiing, could sensor readouts (pick your site- leg vs arm vs chest) better guide you to your best possible time.  This would include uphill sections where you would be in the red (but avoiding severe decompensation), downhill recovery (maybe with some muscle assist if O2 sats are rising) and long flat sections where you would want a steady curve without downward trends.

On a practical note, the use of an android device with Ant+, Ipbike software(it has text to speech capability) and bluetooth headphones could give you an audible sensor readout on a real time basis while training and racing.


So does this help our friend in training and racing?
If we go back to the published literature there is still as of this date, no answer to the question.
A recent review article on muscle oximetry in sports made the following conclusions and recommendations:


However even with the above qualifiers, we can clearly see well defined and reproducible patterns in the above tracings.  Cross country ski related muscle oximetry characteristics will understandably not resemble those of cycling, running or weight training.  I commend and encourage further use of this modality even knowing it may just be of academic use. 
Certainly much more data is needed.

On a theoretical basis, cross country skiing could be a prime use case for costal O2 monitoring, given the variable muscles used, intense overall efforts, high muscular O2 extraction making active muscle site observation problematic for interpretation.  

But here may be an example of cardiac output redistribution nonetheless:

1. Easy skating
2. Fast skating
3. Easy doublepoling
4. Fast doublepoling
5. Easy classic (just striding)
6. Fast classic (just striding)
7. Easy biking
8. Fast biking
9. Easy running
10. Fast running
With Moxy on the RF
And associated leg EMG data:
 

If we ignore the first easy skate(lower O2 possibly just a first set phenomena), one could say that the easy DP leads to more blood flow diversion from the legs(because of high arm usage), hence the lower sats.  The easy DP also does not have higher EMG signals from leg activity making this plausible.
The fast bike does lead to a near zero O2, another example of the amazing O2 extraction capability XCSkier has.  
The fast run has the highest HR, highest EMG but not the deepest O2 desat!  This certainly underscores the pitfalls to simplistic interpretation on NIRS data.

Given my original criticism of the use of leg sensors for race pacing, I wondered if in this case, he could use the leg in this context.  The next tracing was a 30 min time trial, associated with a lactate of 7 at the end, Moxy on the VL.

The O2 is really pretty steady, with each O2 dip associated to a Tot Hb rise - orange markers (outflow compression?).
Given that we don't have a power meter to use in cross country skiing, using this for pacing would be interesting (Ipbike text to speech).
Note: that the HR is always rising, which is less than helpful in how hard to go.  Given that the course was completed with a highish lactate, he could probably have gone an hour with an O2 sat just a tad higher.  I hate to say it (given how critical I have been of sensor usage) but this is compelling as a pace modality in this sport.


Bottom line:
  • Cross country skiing is an extremely demanding sport from multiple standpoints, without any established power measuring devices.
  • O2 extraction rates are among the highest seen, and very low numbers are probably not artifacts.
  • Muscle O2 monitoring (especially through text to speech) may have potential usefulness while racing/training.


Sunday, May 6, 2018

Deltoid desaturation, Data from multiple sources and Moxy Forum

Another clue to spot the change in cardiac output redistribution/exercise decompensation would possibly be a desaturation in truly uninvolved muscle.  As discussed before, the costal muscles are quite involved in the work of breathing at high rates and exertion.  They compete for resources with the legs, hence the drops we have been seeing.  However, it can be tricky to measure with a large sensor and I have been thinking of alternate sites.  According to posts on the Moxy forum, many users put a second sensor on the deltoid as their non involved site.  The following is a review of what I, and they have found in regards to deltoid desat under load.
As a beginning prediction based on previous ideas and tracings, my guess was that some of us with relatively lower stoke volume will desat more than others as a way of shunting blood supply to the legs.  Obviously, if we are already compromising the respiratory muscles, the deltoid is a prime target to "steal" from. Conversely, some athletes with excellent cardiac output will not see much if any of a deltoid drop since they have blood flow aplenty.

The first example is here:
A strong rider with a significant drop in the deltoid saturation at high power outputs.


So the deltoid O2 is 10-20% range at the end.


The next example comes here


Now, we don't have a tracing of his deltoid but he did link the csv data:
 
Notice the excellent mirroring of the deltoid desat to the VL, especially at the end where watts are highest.


The following is also very interesting:


So he noted severe shortness of breath and deltoid desaturation at very high load.

 
We can see that the deltoid drop (line 3) was occurring at high load.
But perhaps even more interesting is the further drop after he stops pedaling. The top chart is showing rapid re saturation of leg muscles but since he probably had major respiratory muscle desaturation (as well as the issue of exceeding respiratory threshold and therefore forced to maintain high respiratory effort after he stopped pedaling), the deltoid flow is shunted even further.


Now back to my own data.
First is a tracing of an 8 minute interval at about 290 watts:
 
The green, 1st SmO2 is the costal, 2nd SmO2 is on the deltoid, watts are in purple.
The deltoid and costal are remarkably in parallel!

Next a 1 min max up a hill, same color coding:
 

Both costal and deltoid bottomed out in the 7-10% range, and did not start to rise until well after stopping pedaling (just like the rider above).  During the 30 sec low level 180 watts after the interval both parameters remained quite low.

As a positive control, just standing over the bike at the end of the ride (no watts, low HR), the deltoid O2 drops below 10% from just raising my arm, verifying both position and sensor performance.


Next - Here is my friends tracing (the fellow with all the endurance SNP's):
 
The deltoid placement was not 100% solid (light leak), but you can see a trend of both costal and deltoid drop (same 1 min max hill).  The costal went from about 82 to 67% and deltoid 75 to 63%.  

What I have tried to show in the above examples is that looking at truly non involved muscle has utility in monitoring pace and training intervals.
As to how we would use this information is still conjecture.
Several scenarios do come to mind:
  • Stratification of athletes into low/high stroke volume classes.
  • Once that is done, lower stroke volume subjects will need to be more careful about hydration, nutrition since gut perfusion will be diminished with high power states.  Recommendations would be for longer rest between strenuous bouts for proper replenishment.
  • High stroke volume subjects may want to work on their strength/muscle mass, which may be more of a "limiter".
  • The use of the deltoid desat curve could also be used analogous to the costal area, for optimal race pacing and time trialing.

As always, this is relatively new use of new technology and much more needs to be done.
I will continue to look at costal/deltoid and leg data in the weeks to come.