Case 1:
This is a quick and dirty look at a ramp done from data sent to me by a reader. I have no info except this:
I did 4 min steps and increased 10w each step. FTP is about 200, max HR is around 190. I was a bit nervous so HR felt a tad high at the start, then was about right when I hit 200w.
I do have a fit file with power data and the HRV logger with RR. The artifacts were well below 5%. I did two plots - HR vs DFA a1 and DFA a1/Power over time.
Let's see how they look:
DFA a1 vs HR - this one is easy to do and interpret - simply plot DFA a1 vs HR from a DFA a1 of .5 (or lower) to about 1, in Excel and look at the intersection:

- HR at the "HRVT" is about 162 bpm
Power calculation can be more difficult - here we need to get the power on the same graph. I did that by synchronizing the timestamps. Then did regression lines for the entire power data, but a regression only for the marked DFA a1:

- The HRVT is about 175 watts.
- For those who don't want to do this, find the power for the average heart rate computed in HR vs DFA a1 - they should be close.
HRV Logger:

- HRVT HR about 168
Conclusion:
- Good looking ramp
- HRV logger data was quite close to Kubios


- How does it look? Very good!
- Not perfect but Logger does capture the general outline well.
HRVT HR


- Both lines look reasonable, but you can see that a few bpm difference is present.
- One is not necessarily "better" than the other.
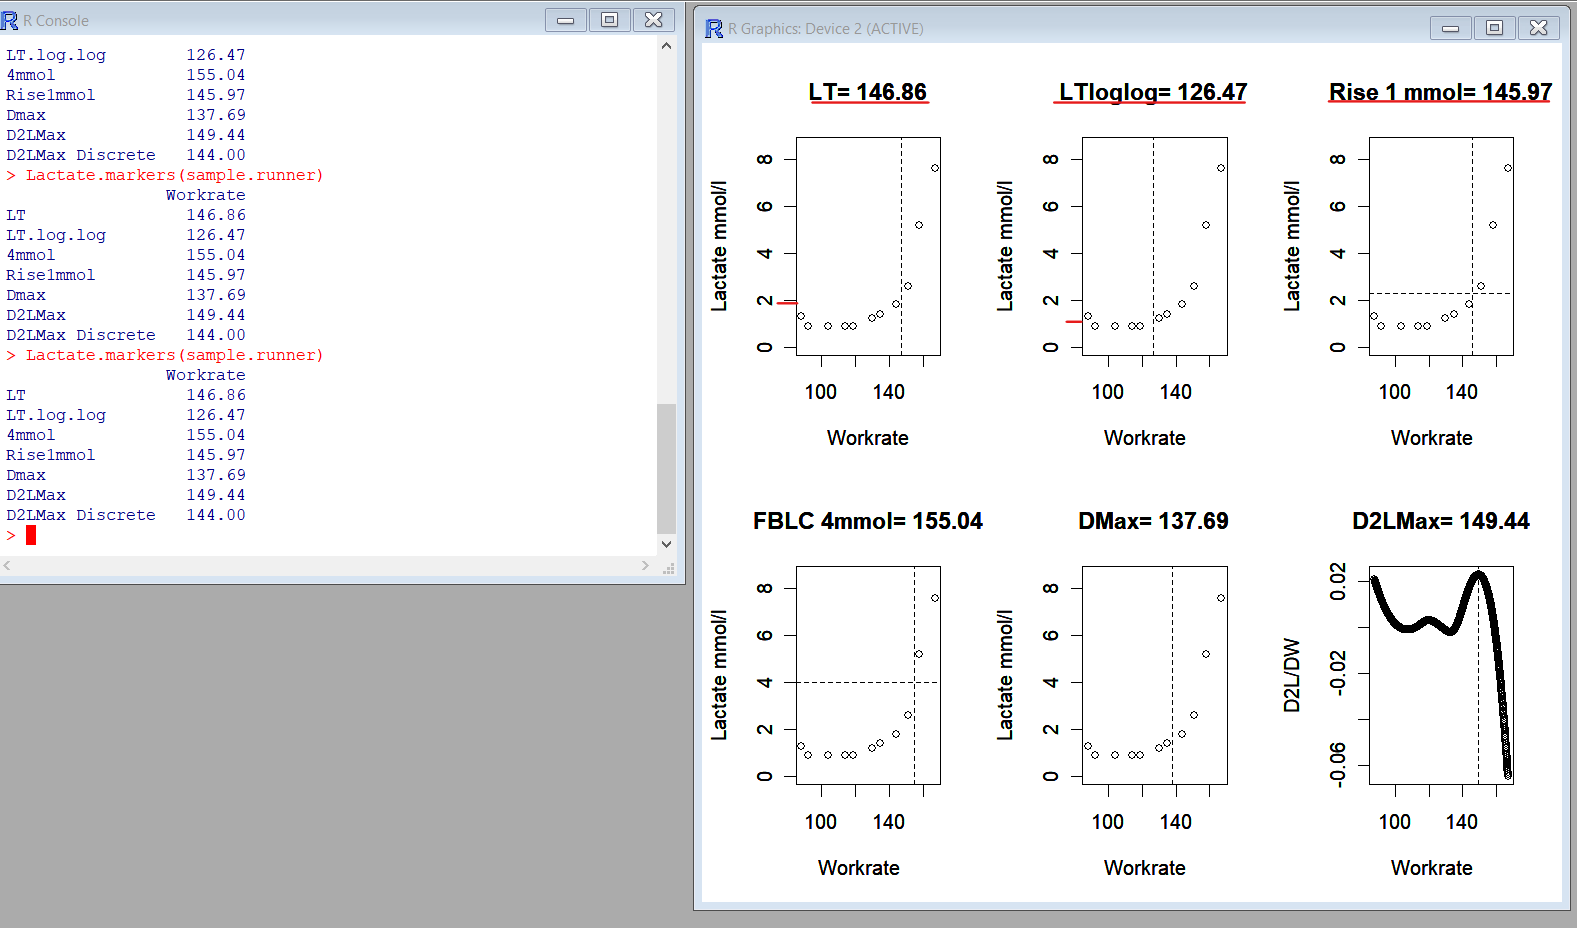
LT definition -
Traditionally, the lactate threshold was determinedLog-log definition -
subjectively from plots of the lactate concentration
versus work rate by visually identifying the treadmill
velocity or work rate that best corresponds to a
departure from a linear baseline pattern. Lundberg,
Hughson, Weisiger, Jones, and Swanson (1986)
proposed fitting a linear spline where the lactate
threshold is the estimated work rate corresponding to
the location of the knot (i.e. the point of intersection
between the two linear splines). The location of the
knot and the parameters of the lines are estimated by
minimizing the sum of the squared differences
between the observed lactate values and the fitted
values.
A log transformation of both the work rate andThe 1 mmol rise is self explanatory.
blood lactate concentration has been suggested
(LTloglog) in an attempt to gain a better estimate of
the lactate threshold (Beaver et al., 1985).
- HRV logger is close to Kubios premium in accuracy.
- Even lactate testing is open to interpretation and argument on what constitutes the LT1.
- Some variability will occur in the HRVT just by plotting - but a few bpm should not be a deal breaker.
- In this case the HRVT sits between the various LT1 markers.


Ramp 2:


- Although HRVT power and HR are not exactly the same, they are within reasonable limits.
- The question arises whether the ramps are comparable since one was after a recovery ride, which could have introduced fatigue effects.
- Another session of two ramps done back to back did not have a good linear a1 drop. Reasons are unclear and I did not have the raw data to delve into why.


- This is an excellent example of a true recovery session where the majority of a1 values are above .75 along with a HR in the appropriate range.
- It also illustrates that the distribution of a1 can be wider than you imagine, despite a steady state power/HR.

I drew a red line to get an approximate HRVT (a1=.5) of 160 bpm. To confirm that, it appears that the SDNN begins to nadir at about that point as well. Although this individual felt that this HR was too high (by prediction), from the autonomic standpoint, it appears to be correct.


R peaks are improved with module inversion!

Another session done the following day showed some mild a1 suppression likely due to persistent autonomic stress with a1 .5 to .8 at relatively stable HR, then a decline (circle) with higher intensity:


- HRVT1 at 160 bpm
- HRVT2 at 172 bpm
- Excellent agreement with gas exchange
Heart rate variability during dynamic exercise
- Firstbeat VO2 estimation - valid or voodoo?
- Heart rate variability during exercise - threshold testing
- Exercise in the heat and VO2 max estimation
- DFA alpha1, HRV complexity and polarized training
- HRV artifact avoidance vs correction, getting it right the first time
- VT1 correlation to HRV indexes - revisited
- DFA a1 and Zone 1 limits - the effect of Kubios artifact correction
- HRV artifact effects on DFA a1 using alternate software
- A just published article on DFA a1 and Zone 1 demarcation
- DFA a1 vs intensity metrics via ramp vs constant power intervals
- DFA a1 decline with intensity, effect of elevated skin temperature
- Fractal Correlation Properties of Heart Rate Variability (DFA a1): A New Biomarker for Intensity Distribution in Endurance Exercise
- Movesense Medical ECG V2.0 Firmware brief review
- Movesense Medical ECG - improving the waveform and HRV accuracy
- DFA a1 and the aerobic threshold, video conference presentation
- DFA a1 - running ramp and sample rate observations with the Movesense ECG
- DFA a1 calculation - Kubios vs Python mini validation
- Frontiers in Physiology - Validation of DFA a1 as a marker of VT1
- Real time Aerobic thresholds and polarized training with HRV Logger
- Active Recovery with HRV Logger
- DFA a1 and exercise intensity FAQ
- DFA a1 agreement using Polar H10, ECG, HRV logger
- DFA a1 post HIT, and as marker of fatigue
- DFA a1 stability over longer exercise times
- DFA a1, Sample rates and Device quirks
- DFA a1 and the HRVT2 - VT2/LT2
- Low DFA a1 while running - a possible fix?
- Runalyze vs Kubios DFA a1 agreement
- DFA a1 - Runalyze vs Kubios vs Logger results in a cyclist
No comments:
Post a Comment