One of my "wish list" items has been identifying my "maximal lactate steady state" without actually doing the maximal effort testing. After all, these are tough tests that impact recovery and are generally (very) unpleasant, especially as we age.
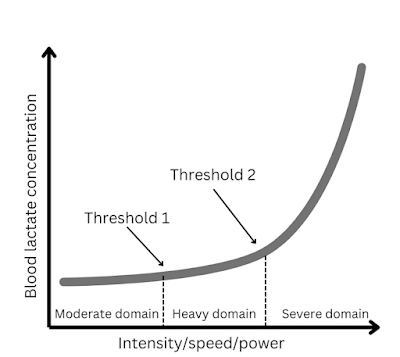
Well over 1 year ago, I had an idea of a way to determine the second HRVT using only data up to the "heavy" intensity domain/zone 2. HRVT2 intensity corresponds to the "maximal metabolic steady state", (AKA - the RCP, second lactate threshold, MLSS, FTP, critical power, heavy severe domain boundary, and zone 2:3 transition). The HRVT2 is usually measured by ramp efforts to failure or at least passing the severe intensity domain (which is not trivial).
Here are some graphic plots regarding zones/domains:
Or something like this:
The idea of using submaximal ramp data was based on several years of interpreting exercise DFA a1 trajectories that usually are linear from 1.5 to 0.5, as noted below:
As we can see in the figure above, the linear relationship from 1.5 to about 0.75 should suffice to get us a "predicted" HRVT2 without actually reaching that intensity. This would be a major boon to those who can't do a full ramp to exhaustion for various reasons. Indeed, one of those reasons can even be the desire to "take it easy," yet still identifying the HRVT2 with decent precision.I ran this idea by Juan and Pablo over a year ago, who (as usual) were supportive of the investigation. Many may not realize that the time lag between the "hypothesis" and publication can be substantial. This paper was submitted many months ago, and although I wanted to share the results, one can't do that until acceptance and the "embargo" ends.
Below is the full text with references and a short take home summary. Many thanks to Juan and Pablo for the raw data, support, and encouragement. This is our seventh publication together, and it's been a blast working with both of them. I've learned a tremendous amount academically but also some skills in the "how-to" publication sphere.
Here is the link to the official publisher website.
Take home summary:
It is possible to predict the HRVT2 heart rate (AKA - second lactate/ventilatory threshold, RCP, MLSS, CP, FTP) with only submaximal HRV data. This prediction is usually quite close to the standard HRVT2 derived from a full ramp to failure.
But, several factors must be considered:
- Make sure the chest belt placement is optimal - check R wave morphology/voltage before doing the test. This is one of the most common mistakes in a1 research from my point of view. As we've seen in other posts, it makes a difference.
- Don't perform the test unless you are fresh and healthy. For example - Doing this the day after an exhaustive effort may lead to erroneous results from autonomic suppression. The plot may be linear, but not associated with the MMSS.
- Trustworthy results should have an unambiguous line of regression - if the a1 plot is equivocal, do the test again. Ideally, you will see a plot as in Figure 1 above. However, if there is a1 undulation (drops, rises, drops, rises) I would not trust the test.
- Lastly, many thanks to Ian Peake for the brilliant work creating Fatmaxxer. The app was critical to the success of this project!
Since this is submaximal data, the test can be repeated often, without affecting training regimes or rest days.
To Blog index........


Dr. Rogers, first, I've been historically very impressed with the quality of the research you and your colleagues have generated (and with many thanks to Richard Wharton with whom I trained on line during the Covid debacle). That said, I am an "aging-athlete" secondary to being 87 years of age with a 45+ year history of endurance training coupled with HIIT resistance training, roughly 50% of which was negatively accentuated.
ReplyDeleteThere is as you likely know a virtual absence of literature addressing the determination of VT2 amongst those of us who deal with the CV compromise associated with my history. While my BP is well-controlled (with confirmatory data derived from the SphygmoCor's CONNEQT) and medication, and KUBIOS HRV Readiness app reporting a Physiologic age of 56 (Garmin has me at 59.5) "sic", persistent Kardia single channel ECG 50% of my readings demonstrate NSR w/SVT ectopy. With that as context, how does someone with this kind of Hx accurately determine threshold values? Keep up the good work. I miss G'ville enormously. :) Tony
First - " With that as context, how does someone with this kind of Hx accurately determine threshold values?" - your best bet is lactate testing. The LT1 is easy - just start with low power 5 minute intervals, test La and when it begins to rise above baseline, you are there (HR and power). For LT2, use the submax method I cite in the above paper (J Sports Sci Med 22: 68–74, 2023). I do this myself and it's very close to my HRVT2/RCP/HHbBP. Depending on how bad the SVT is, using a1 may not work. If it's just sporadic or some APCs, you should be able to take advantage of dynamic HRV for thresholds and/or durability/readiness. Remember the cutoff for a1 artifact is about 5%. Thanks for the kind words and best of luck. We old guys need to stick together.
ReplyDeleteDr. Rogers, thank you kindly for reminding me of that option. Lactate device next purchase. :) Take care, Tony
ReplyDelete