Acknowledgment - I would like to thank the Kubios team and project founders for continuing to enhance and improve it's functionality. In addition, I can honestly say that most if not all of the interesting work we have done with DFA a1 and exercise physiology may not have occurred without this program. A good analogy is that of a grand tour rider and their teammates/support staff - it really does take the entire team to create a winner.
Updated 10/24/22 - added section on multi user/athlete recording and cloud uploading
Updated 2/2/23 - New RR aberrancy markers and bug fixes
Last week a new, enhanced version of Kubios HRV software was released that includes a "training report" and direct Polar H10 ECG recording with cloud file storage. What this means is that for those of us interested in HRV related intensity thresholds, the software will now do an automatic calculation showing both VO2 and HR at the AeT (VT1) and AnT (VT2). In addition, using the companion mobile app, you can record Polar H10 ECG (with a running visualization) for later cloud upload and desktop analysis. These features are on top of the previously discussed respiratory rate estimation based on either HRV or ECG fluctuations.
ECG recording
Before going into the Training Report with DFA thresholds and intensity zone tracking, a brief look at the ECG recording capability is in order. You will need to be a registered user for the Scientific version to save the ECG file. As discussed in previous posts, ECG display is an integral part of not only getting the most precision out of HRV recording, but can make a huge medical difference by identifying arrhythmia and early signs of atrial fibrillation that can be common in endurance athletes. As discussed above, there are smartphone apps to record continuous ECG data from the H10, but many are not completely stable and crash when you need them the most. I'm hopeful the Kubios implementation will not suffer from that issue.
Open the Mobile app - Start a Custom measurement - Choose the ECG toggle - Record the tracing:
When done, upload it to the Kubios cloud site, then "sync" the files to your PC afterward (the sync function is in the PC program).Are there advantages to this over some of the other apps?
Yes and No - All apps at their best will record the voltage over time from the H10 unit (all at a fixed 130 Hz sample rate). However, if you were a coach, running a lab or involved with groups of athletes/patients and you wanted to monitor and store the records, the Kubios solution seems the optimal route.
Training Report
This is where several metrics are tracked through part or the entire exercise session (HR, Resp, DFA a1, VO2 estimate). This includes DFA a1 threshold determination. I will admit that I have no idea how it's done, that info is not in the documentation. So let's just skip to the question of how well their net HR result agrees with the conventional way we calculate the HR at the first and second thresholds.
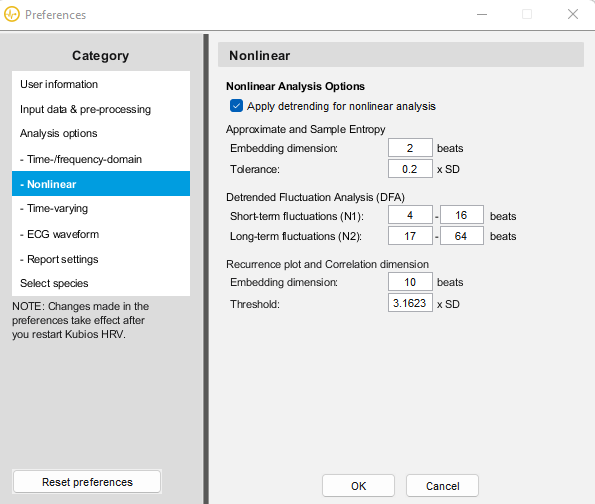
Before jumping into that, I recommend going to the preference menu and changing the default nonlinear beat options to the one below (short term fluctuations to N1 between 4 and 16):
Note that the N1 default is 4 to 12 which may yield different DFA a1 results
Window width = 120 sec
Make sure Ventilatory thresholds are calculated as DFA a1.
Next - Load a ramp file (File/Open). As of this writing, I'm not sure how well the algorithm will work with a mixed session (or multiple intervals) for threshold analysis.
Select the Reports menu - Training Report
You will then get this dialog box:
Select "Whole data" and detect Recovery automatically. If you had a long warmup before the ramp, make a custom "Sample" to encompass the ramp and a bit of the cool-down.
Note -The previous bug is now fixed - you may select a portion of the ramp or session for more exact analysis.
Training report output:
- The red arrow points to the HRVT 1/2 (184 and 195 bpm in this case).
- The red box is the DFA a1 over time (using the default "auto" artifact correction), an estimate of VO2 (using established equations based on age, BMI, HR or user defined).
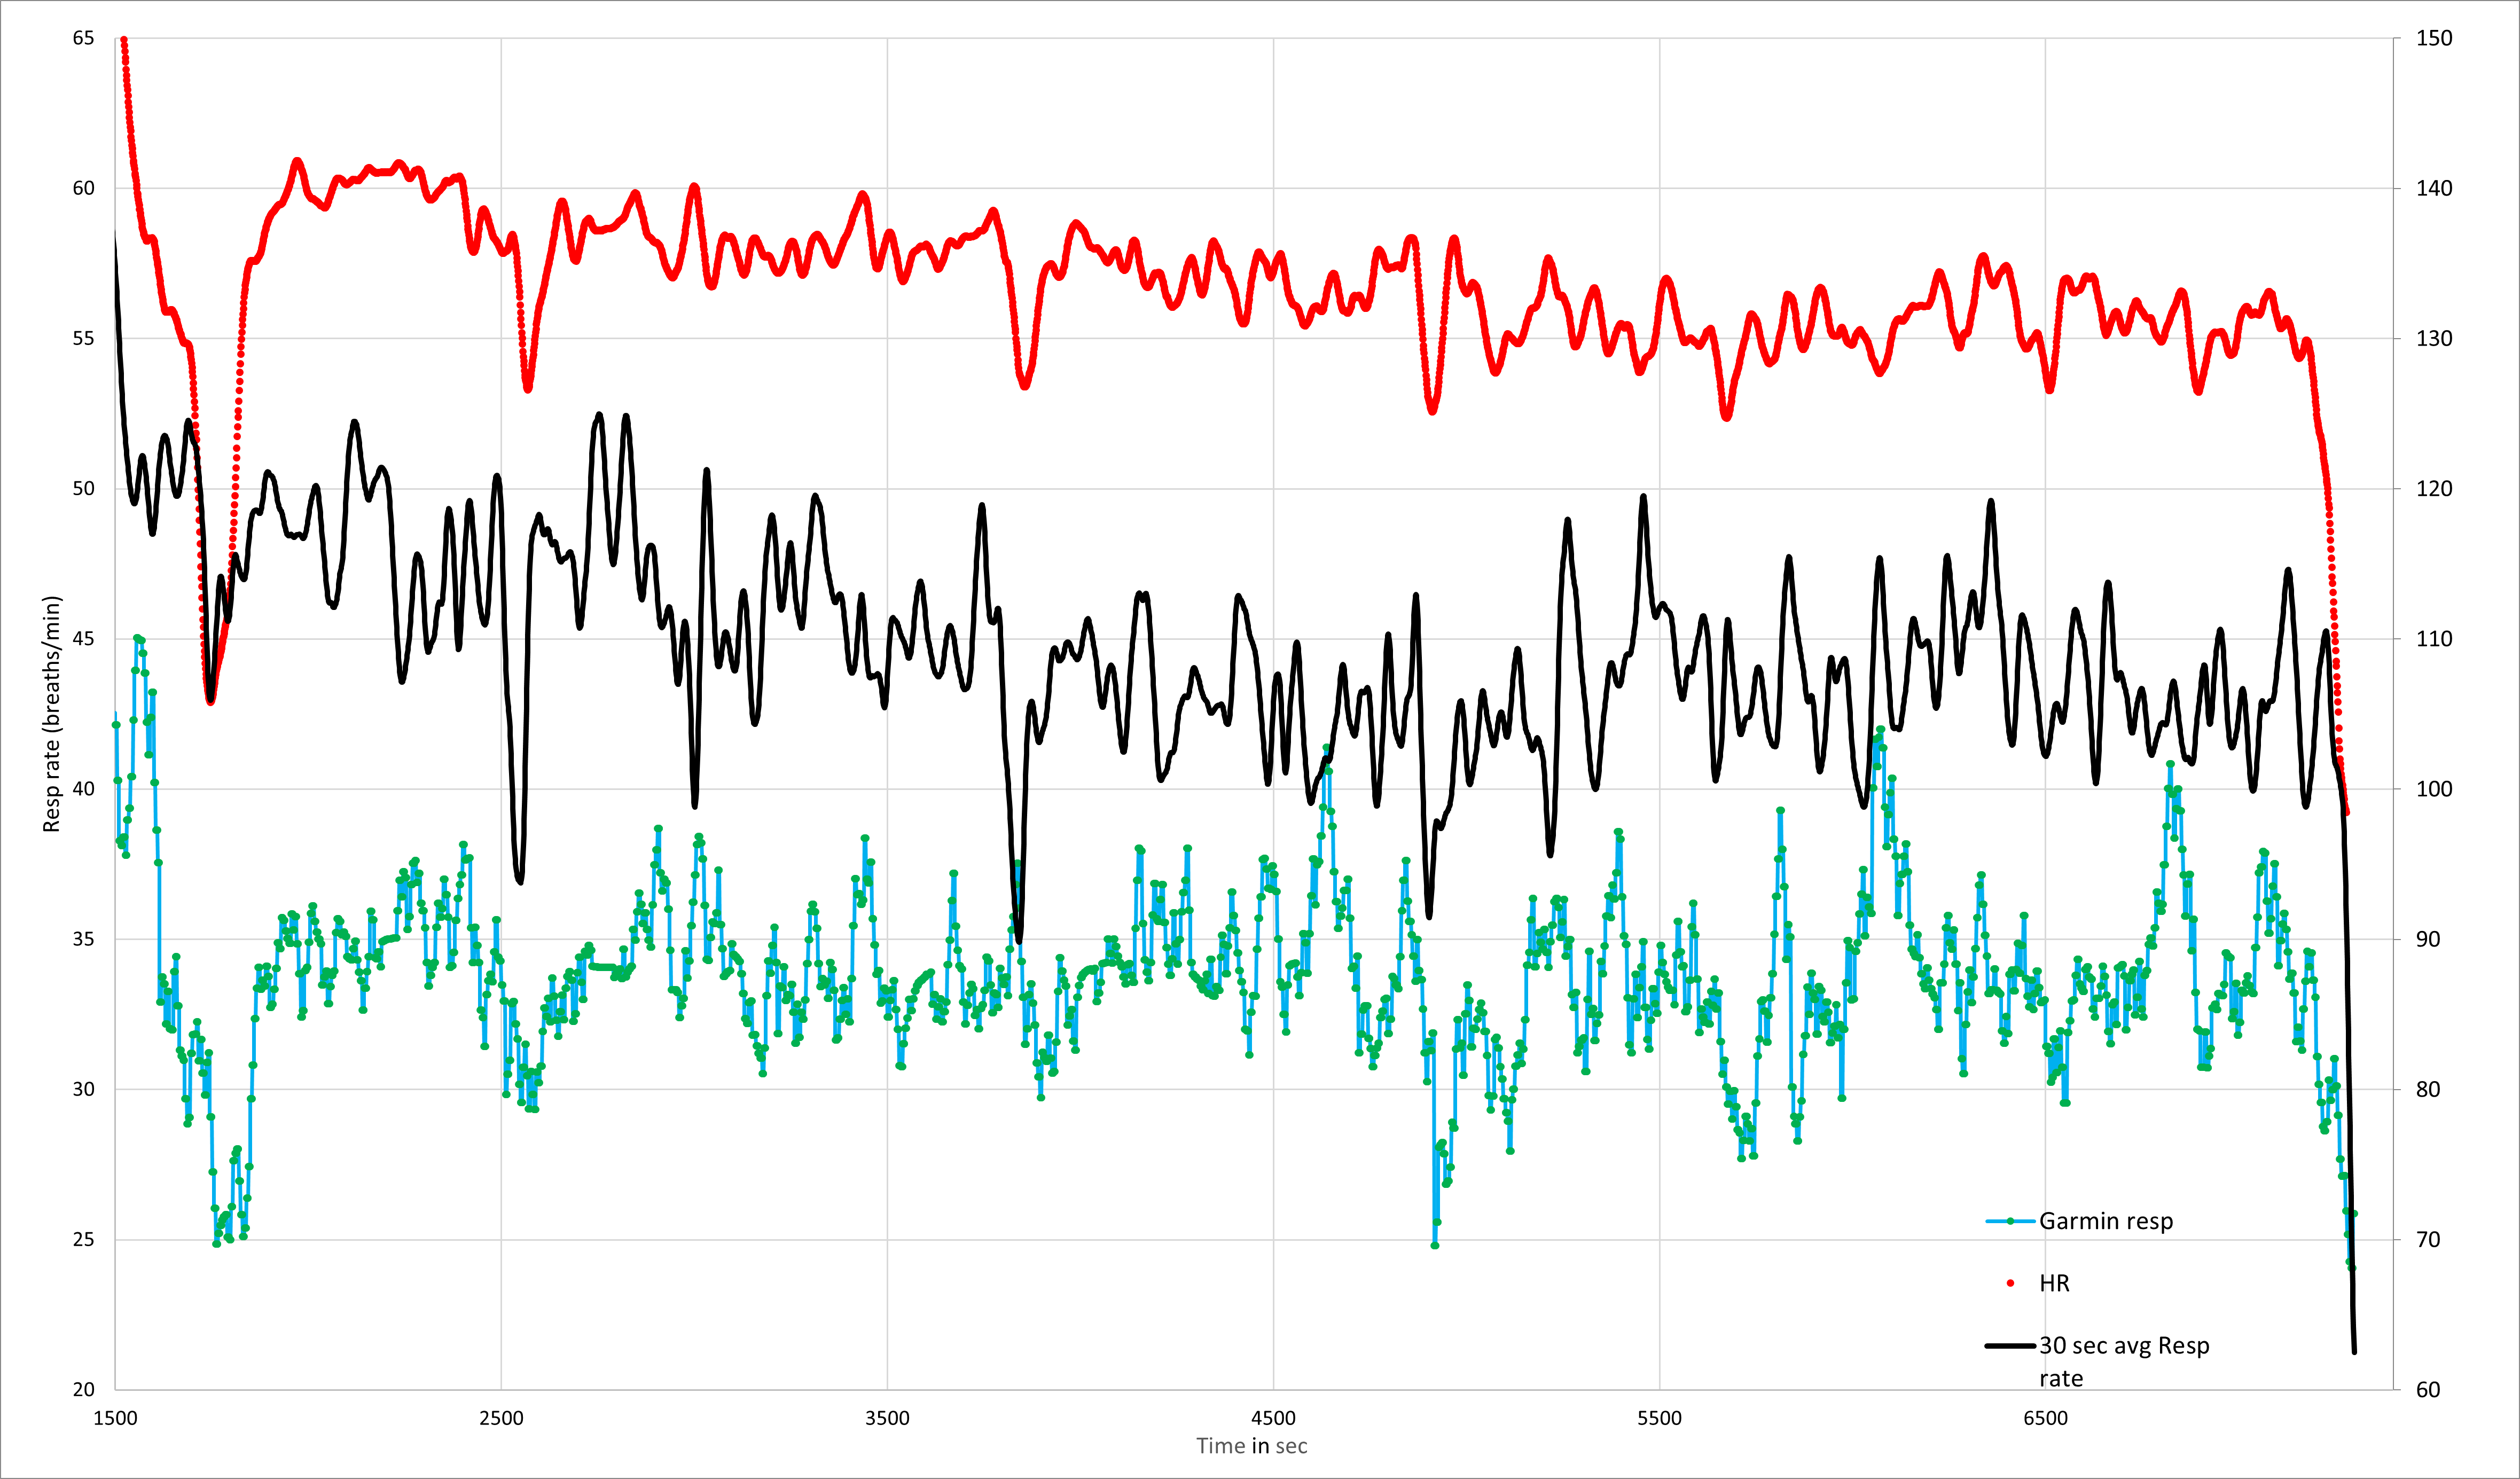
- The green box is the HR/respiratory rate over time.
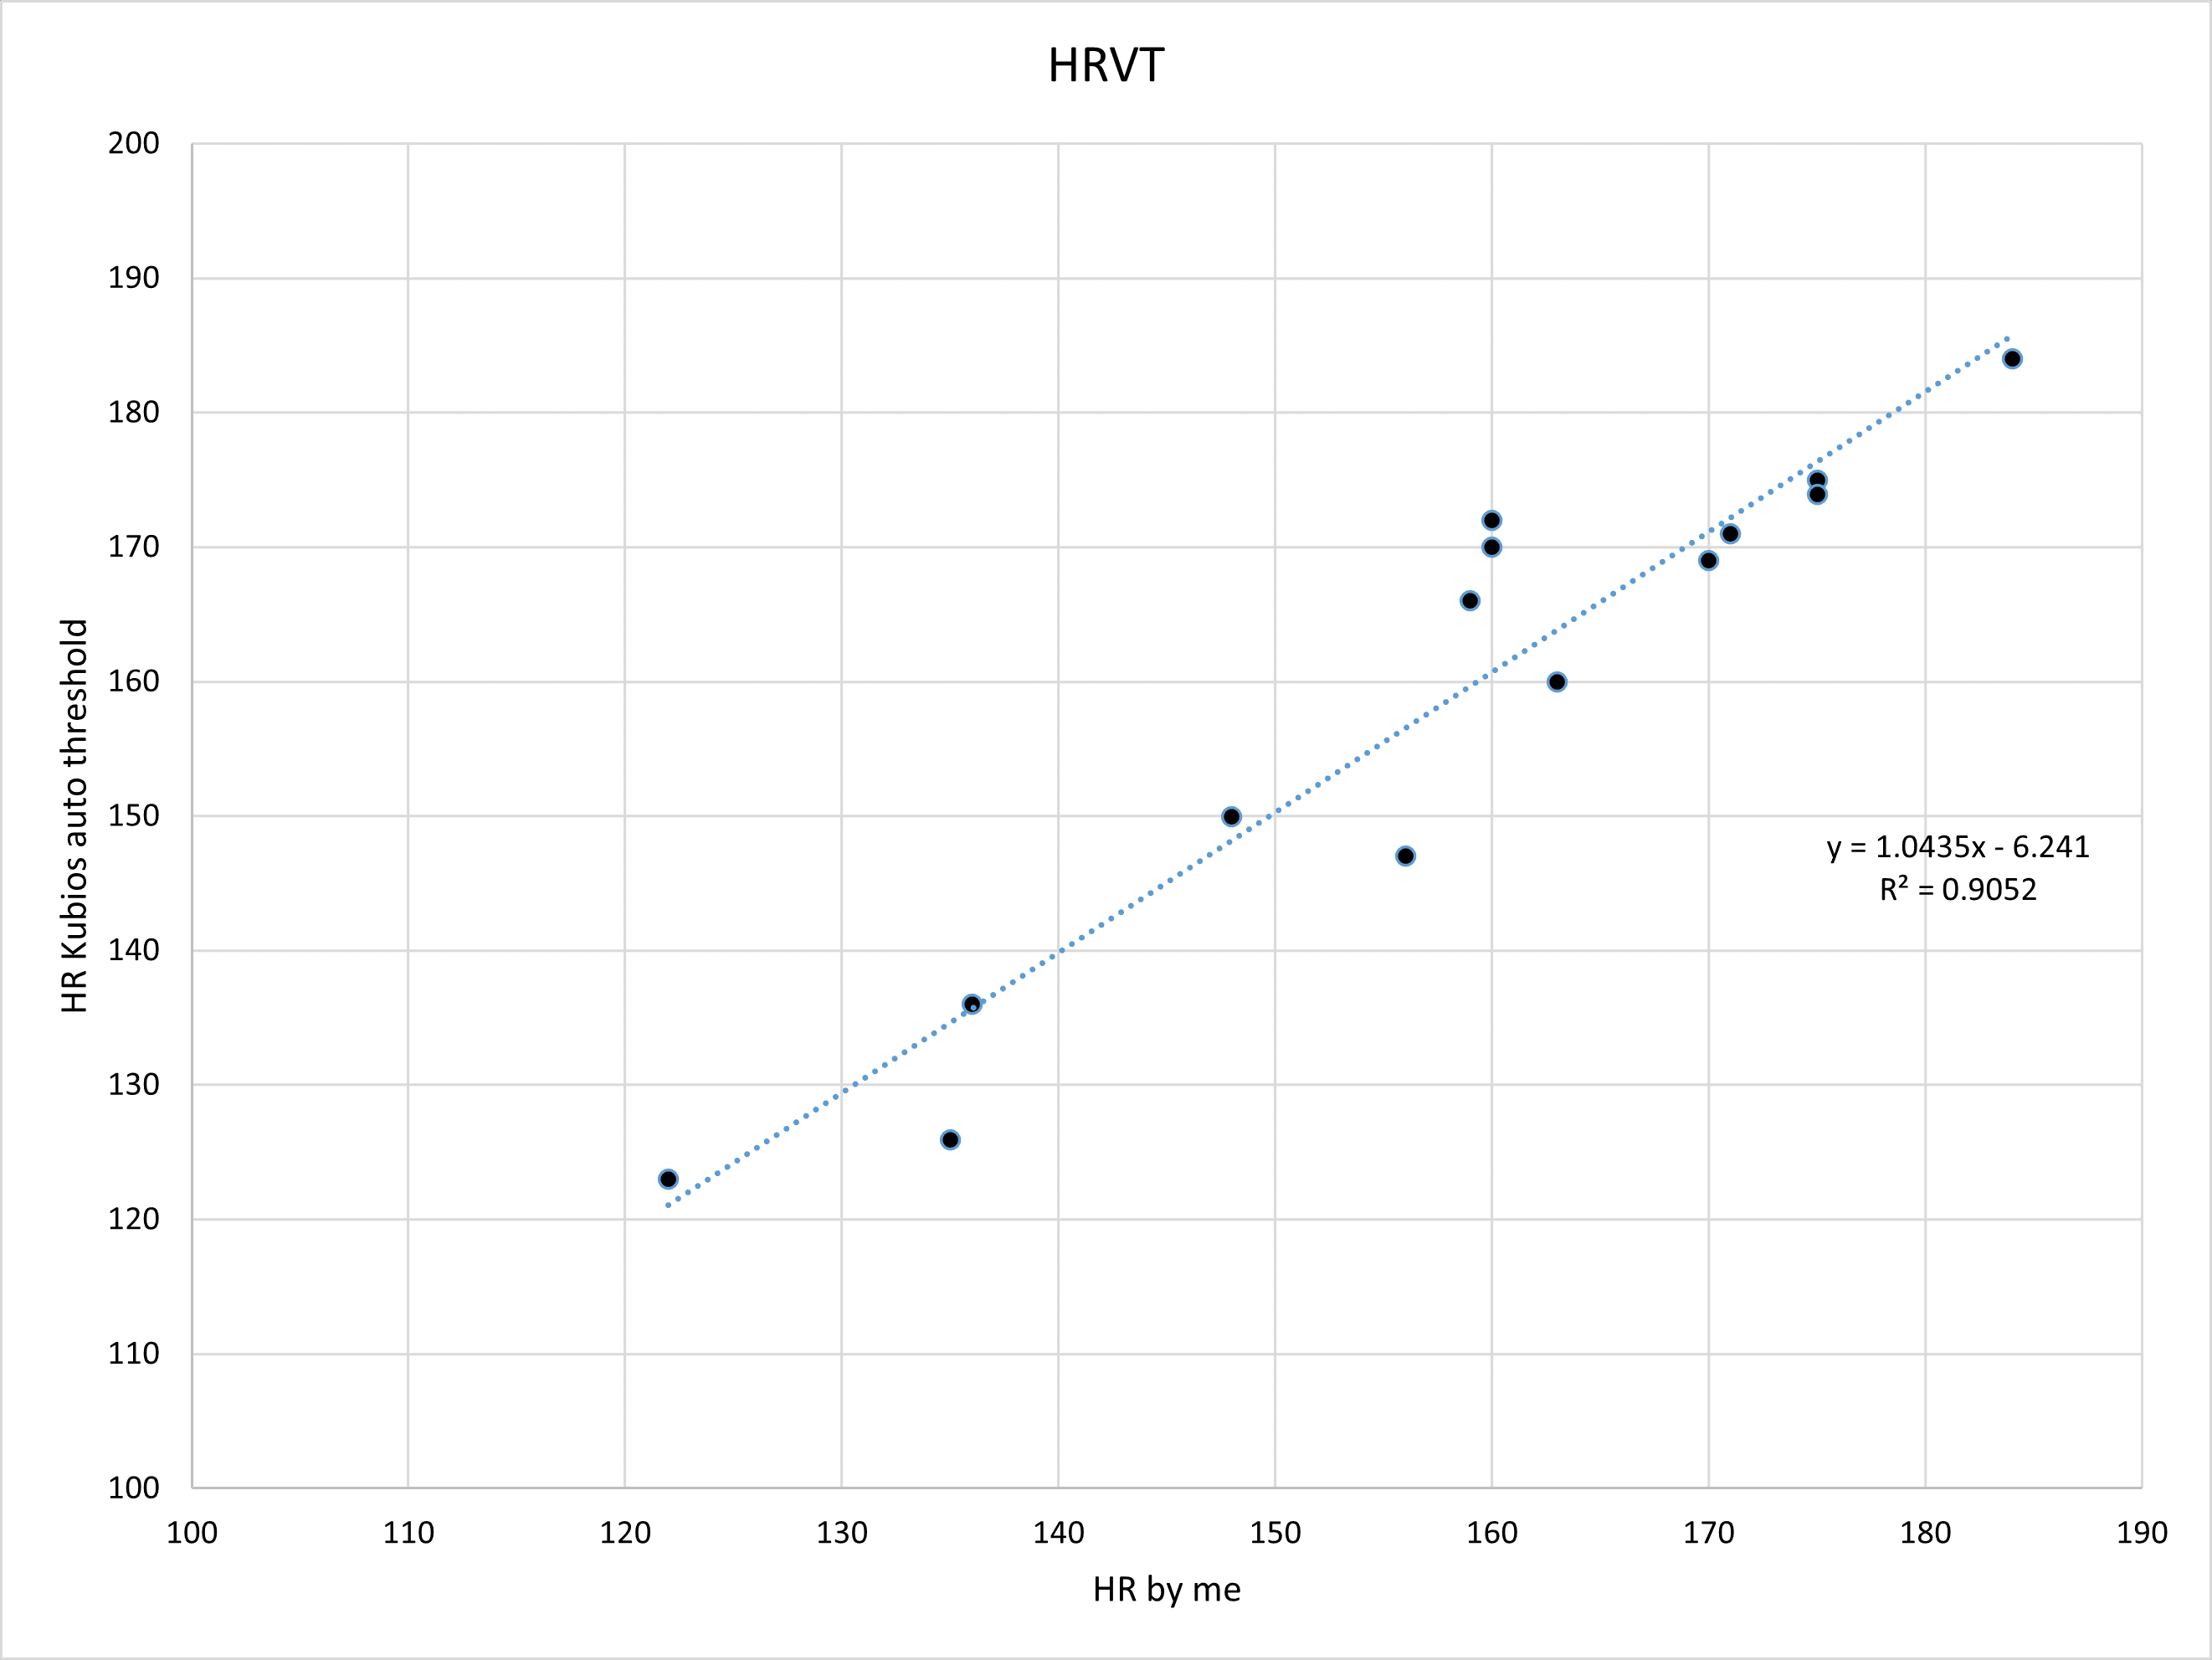
The above report is based on one of the participants in our original validation study - and the numbers were quite close to what I obtained manually (plotting the HR vs DFA a1 using linear regression - bottom figure):
- Since the Kubios training report HRVTs were so close to the "hand done" output, I decided to go through the entire participant group and compare "manual" vs whatever Kubios Scientific is doing.
Let's take a look:
Regression plots for each threshold:
First (AeT)
Second (AnT)
- R squared correlation coefficients are very good, if not excellent (more on this below)
- HRVT2 appears to be tighter than HRVT1.
Bland Altman difference analysis:
HRVT:
HRVT2:
- Many results are spot on but some are noticeably different.
- Mean first and second threshold determinations for the entire group were very close - within 1 bpm:
Why they are not identical?
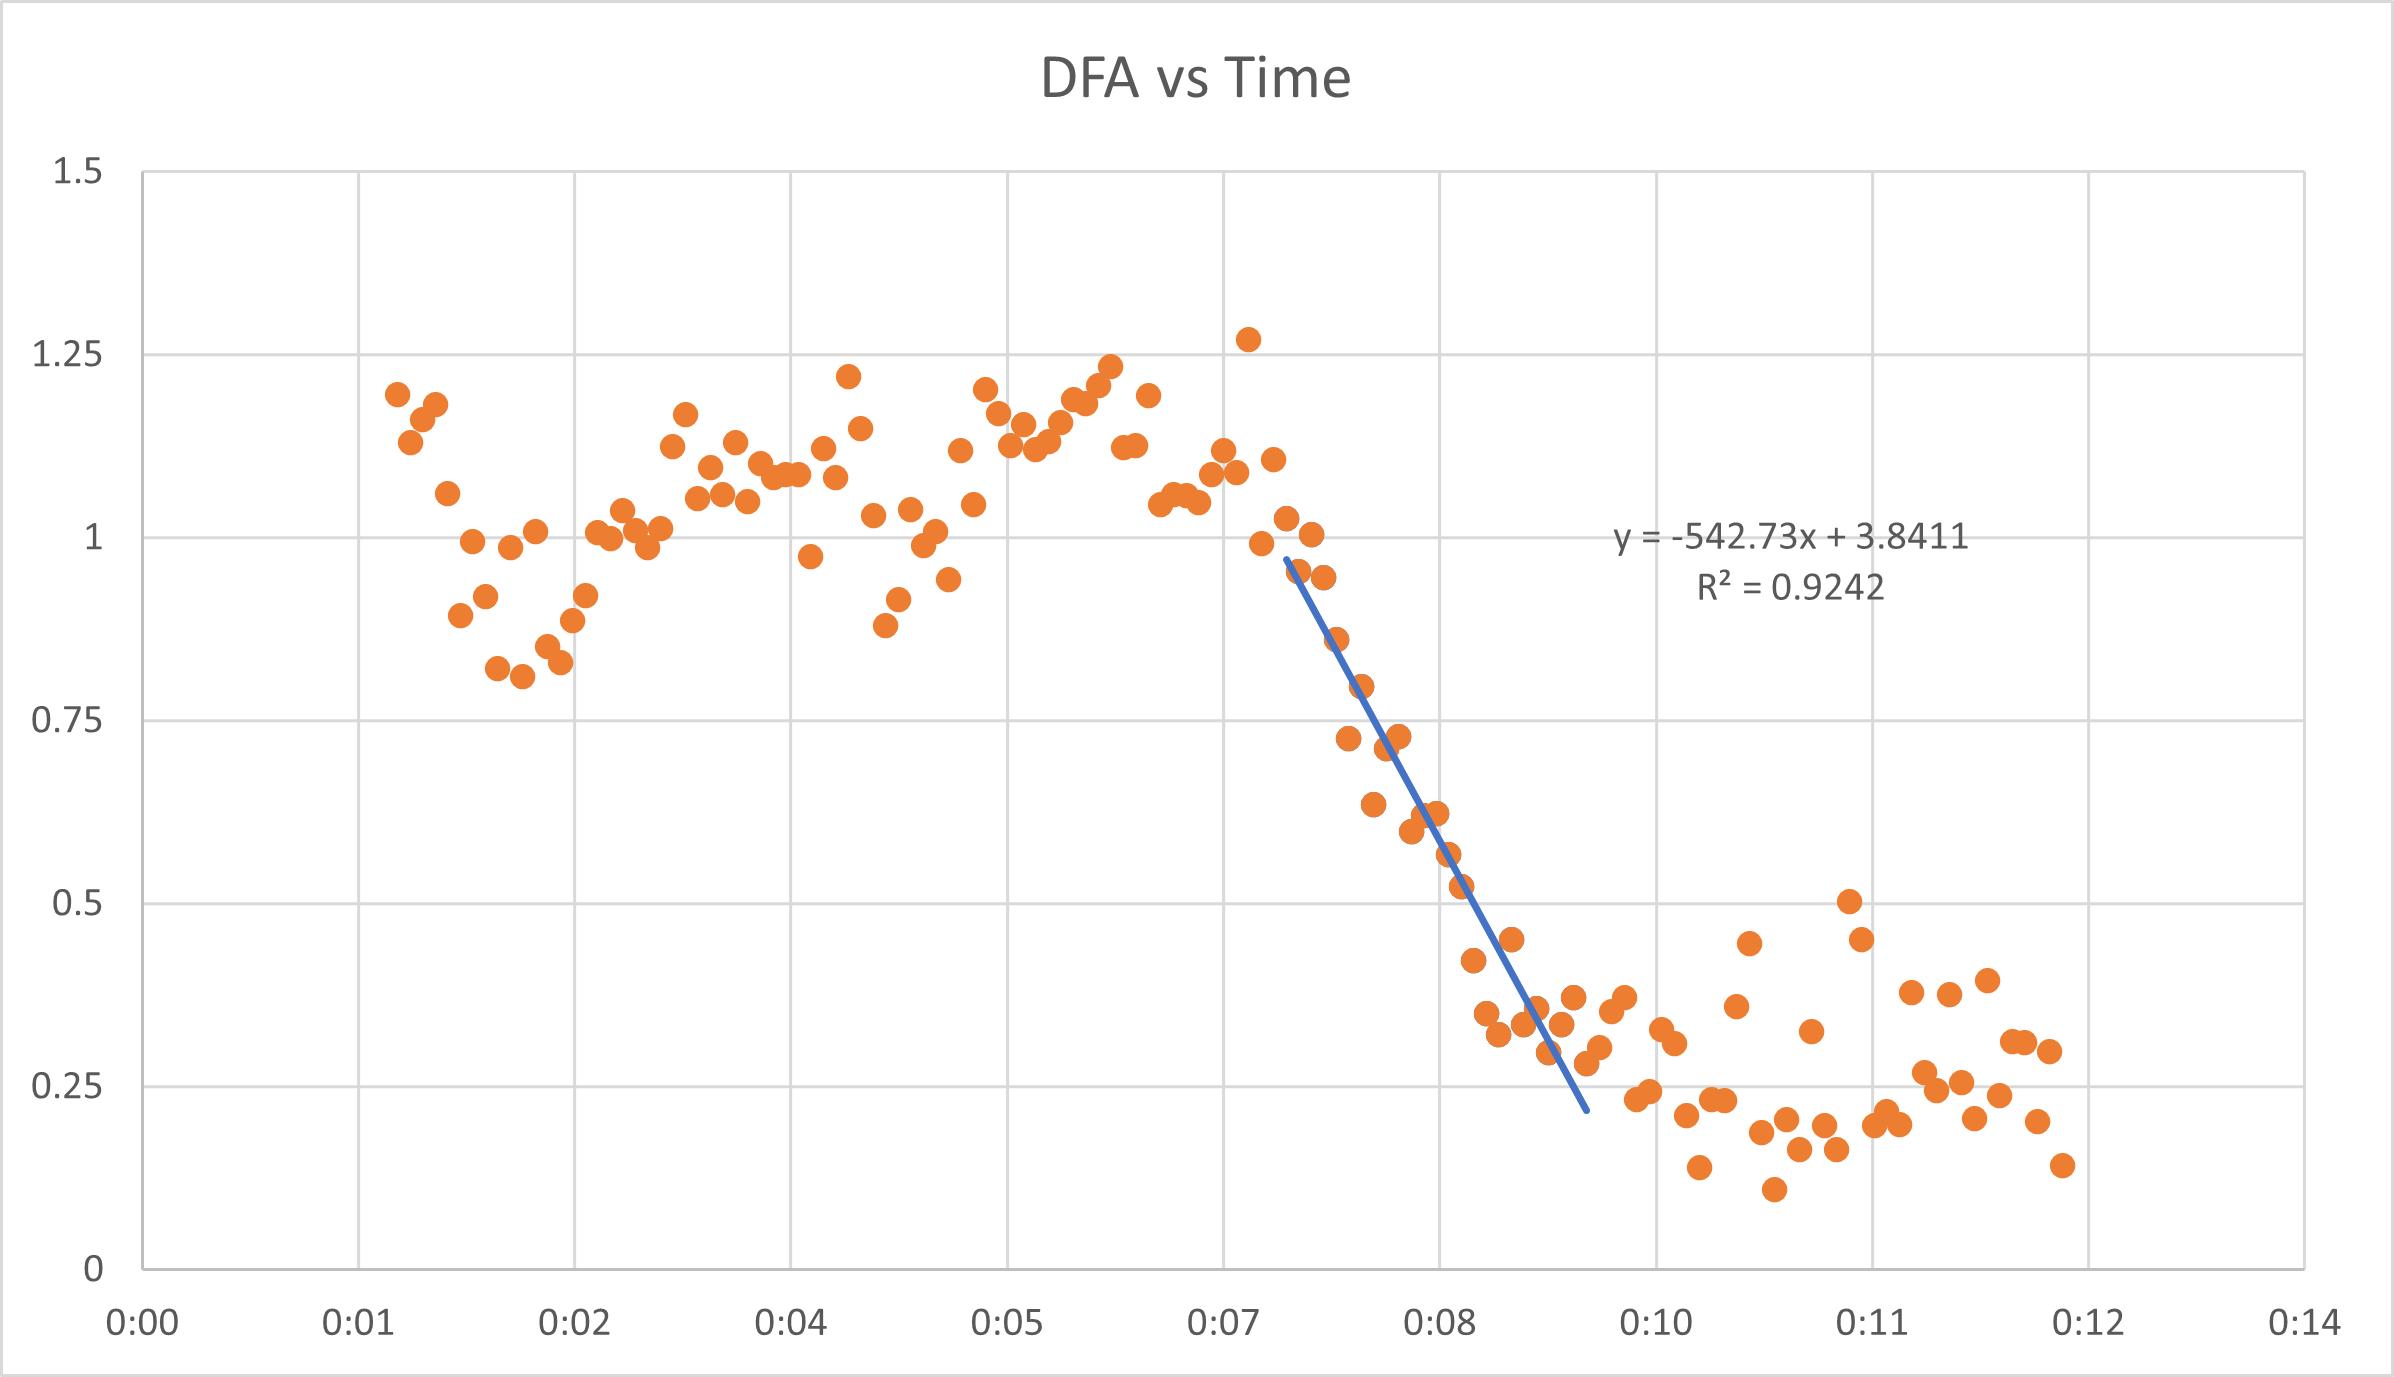
- Possibilities include the underlying methodology (we used HR vs a1 regression through the near linear section of decline). The "training report" might use something else (a1 vs time then back solve for time:HR/VO2).
- The choice of which points to use for regression is another major factor.There is no exact standard - I personally look for the series of data points to optimize a straight line.
- Does Kubios account for nadir values (and not to plot them) and how early does it start to count the points for regression?
Another interesting issue (in one of the participants) was failure of the "automatic" artifact correction method to properly handle a few atrial premature complexes resulting in a skewed data series:
On a first look through the participant data, there was an outlier who had this training report. Outlier meaning the Kubios threshold was very different than the one I derived.
- As you can see, the DFA a1 over time drops then rises again, then drops (purple arrow and circle).
On closer look, my original analysis did not have that (from my old worksheet):
A look at the ECG tells the story:
Here is the original raw file:
- There is a series of 3 non consecutive APCs (the green arrow and green circle show the middle APC in the blue 2 minute measurement window.
- The app does not seem to think these beats are abnormal, keeps them in the series and the result is the bump in a1 (orange circle on bottom pane).
However, if I manually delete just those 3 beats (which I did on the original years ago), the plot smooths out:
- I unchecked the 3 APCs (no red "+" anymore at the green circle) and the a1 flattens out (yellow below).
- This is meant as a warning - look at the DFA a1 over time output - if it has a strange pattern, either redo the test, consider other reasons for that behavior and look at artifacts carefully.
- The HRVT was markedly improved by doing the beat correction.
However, if a coach, physiology lab or group were interested in a quick, objective ramp threshold estimation, this appears to give reasonable results (especially if nothing fishy appears in the a1 tracing plot). Certainly, YMMV depending on artifact, signal quality and day to day variation. The artifact issue above would affect a manual a1 calculation as well.
New feature 2/2/23 - "X marks the spot"
If we are attempting to identify abnormal beats, it would be nice to see which ones are not in keeping with Kubios timing predictions. This is a key to APC identification (since at high HR we can't see the P waves well). In the past, it was best guess - there were no timing markers. Now, the app will circle the R peak marker if the beat is aberrant (early or late)
In this case each APC is early, (the green arrow) but the beat after the APC is late (also classified as aberrant). We can now easy see which of a series is aberrant and where they are.As frequent APC are forerunners for SVT and possibly a fib, this is a great feature to have.
Training Zones:
As part of the training report, the app will now calculate the amount of time you spend in zone 1, 2 or 3 as determined by DFA a1. This is potentially a game changer! Previously, you would have needed to export the time varying output to Excel and manually do the calculations. None of the Web apps (Runalyze or AIEndurance) inform you as to the zone times related to DFA a1.
Here is one example of my own reviewed in the previous post as an illustration of lactate/respiratory rate vs cycling power to determine the polarization index (4 minutes in zone 3 by cycling power, but far longer according to lactate/resp rate):
The DFA a1 zone report is boxed in green (listed as "HRV thresholds"):
- Over 8%(12 min) of the session was spent in zone 3 (a1 < .5) and 75% in zone 1 (a1 > .75). That 8% (12 min) in zone 3 (by DFA a1) contrasts to the total of 4 minutes spent in zone 3 calculated by power (see the 2 spikes in HR corresponding to the HIT intervals).
- This again illustrates the difference between measuring exercise load from external markers (power) vs internal markers (DFA a1, resp rate, VO2 or even lactate).
- One must also realize that fatigue/illness or any other condition that may suppress the autonomic nervous system can alter DFA a1 behavior. Hence, repeating the exact same workout as above if I was fatigued/over reached would have skewed the zone report. That is still a potentially helpful clue to ANS status and whether or not you should back off on training intensity.
Multi User input:
For those of us managing multiple tests subjects, athletes or rehab clients, I would like to go through the appropriate procedure to manage this. As an example, let's say you have the Scientific version and have 2 test centers running simultaneously with each tester having a different device (android or ios). They would both need Kubios mobile on their phones then log in with your user name and password. Once on the main screen.....
Go to - a new Custom measurement on the main screen:
Press that and we get this:- I have chosen both RR and ECG, but my name is in the "subject" box.
- We want to change that:
What needs to be done is to press on the "Bruce Rogers" Subject box to get this:
We will need to press the "Add new" on the top right.
Then you can enter the details for the new user, or whoever is getting the test:
I added "New user" but did not fill out the details below it. Once done, hit the "Done" button
Now we are back to the original screen, but instead of my name, the "new user" is selected. On the info box below it, you can add any details about the test.
Then just press the proceed button and you can start the recording:
Press start
When finished, save the recording, go to your PC, then to the Kubios main app, select Tools/Kubios cloud sync, chose the synch process, then go to the folder you selected for downloads to view the results.
Summary:
- The new Kubios HRV Scientific software is now capable of automatic calculation of the HRVT1/2. For accurate readings, perform an incremental ramp when physically and mentally fresh.
- It appears that the agreement with "manual" methods is excellent based on comparing it to our original studies.
- However, blind usage of the resultant HR data may be problematic. Make sure there is a section of near linear DFA a1 decline over time - if so, the resultant threshold output will probably be close to doing it by hand.
- Having ECG output is indispensable. It's important to both optimize signal strength, waveform shape and perhaps most importantly, differentiate noise artifact vs arrhythmia. If you do see aberrant beats as in the above example, consider manual beat deletion if the DFA a1 curve is atypical.
- Kubios Scientific is capable of directly recording the H10 ECG with the companion mobile version for iOS or android. There is cloud storage ability to be used with the PC version for detailed review.
- As an added and unique feature, training zone distribution based on an autonomic (internal load) marker is automatically calculated using DFA a1 data.
- Finally, remember to interpret DFA a1 as an indicator of ANS status and as part of the "network" theory of exercise physiology. Inappropriate suppression compared to prior historic values may be due to many diverse factors (fatigue, illness, de-training).
Heart rate variability during dynamic exercise
- Firstbeat VO2 estimation - valid or voodoo?
- Heart rate variability during exercise - threshold testing
- Exercise in the heat and VO2 max estimation
- DFA alpha1, HRV complexity and polarized training
- HRV artifact avoidance vs correction, getting it right the first time
- VT1 correlation to HRV indexes - revisited
- DFA a1 and Zone 1 limits - the effect of Kubios artifact correction
- HRV artifact effects on DFA a1 using alternate software
- A just published article on DFA a1 and Zone 1 demarcation
- DFA a1 vs intensity metrics via ramp vs constant power intervals
- DFA a1 decline with intensity, effect of elevated skin temperature
- Fractal
Correlation Properties of Heart Rate Variability (DFA a1): A New
Biomarker for Intensity Distribution in Endurance Exercise
- Movesense Medical ECG V2.0 Firmware brief review
- Movesense Medical ECG - improving the waveform and HRV accuracy
- DFA a1 and the aerobic threshold, video conference presentation
- DFA a1 - running ramp and sample rate observations with the Movesense ECG
- DFA a1 calculation - Kubios vs Python mini validation
- Frontiers in Physiology - Validation of DFA a1 as a marker of VT1
- Real time Aerobic thresholds and polarized training with HRV Logger
- Active Recovery with HRV Logger
- DFA a1 and exercise intensity FAQ
- DFA a1 agreement using Polar H10, ECG, HRV logger
- DFA a1 post HIT, and as marker of fatigue
- DFA a1 stability over longer exercise times
- DFA a1, Sample rates and Device quirks
- DFA a1 and the HRVT2 - VT2/LT2
- Low DFA a1 while running - a possible fix?
- Runalyze vs Kubios DFA a1 agreement
- DFA a1 - Runalyze vs Kubios vs Logger results in a cyclist
- Best practices for Runalyze and DFA a1 thresholds
- ACSM - HRVT validation in a cardiac disease population
- FatMaxxer - a new app for real time a1
- Another look at indoor exercise without a fan
- ECG artifact strips from Fatmaxxer - a guide
- ECG arrhythmia and artifact visualization tips
- DFA a1 as a marker of endurance exercise fatigue
- To train hard or not, that's the question
- DFA a1 HRVT and Ramp slope
- DFA a1 and optimal HRM belt position
- DFA a1 threshold in a cardiac population
- Rapid HRVT graphing and interpretation
- Atrial fibrillation - warning signs from chest belt recordings
- A tale of 2 HRVs - afib vs noise
- Pitfalls in DFA a1 - Polar belt position
- AlphaHRV - the first native Garmin DFA a1 data field
- HRVT validation in Elite Triathletes
- Recent podcast at Scientific Triathlon 3/22
- The DFA a1 App Matrix
- New - Review in Frontiers in Physiology
- Fitness Dashboard - initial review
- Respiratory Rate metrics, ECG vs HRV, Kubios vs Garmin
- Respiratory rate correlation to lactate during exercise