New post - Improving the HRVT1 agreement - IJSPP 10/2024 - please read through this as it is the most up to date review/calculation method for HRVT1 and HRVT2. I will be updating the FAQ shortly....
With the recent interest in using the DFA a1 HRV index to determine aerobic thresholds, to follow exercise intensity (Runalyze and AIEndurance) and the use of real time DFA a1 output from alpha HRV for Garmin and Fatmaxxer, I've decided to put together a "frequently asked questions" list. This is by no means totally inclusive and will be updated on a regular basis as new questions (and answers) come up.
What is DFA a1?
- Simply put, it's an index of heart rate, beat to beat, fractal related self similarity. Although your heart rate may be 60 bpm, the beats are not occurring exactly every 1.000 seconds. The pattern of self similarity changes as exercise intensity rises, from values well above 1, moving down to .75 near the aerobic threshold and dropping even further above this exercise intensity. See the articles below for details.
- Uses of a1 observation include first and second ventilatory/lactate threshold estimation as well as monitoring for fatigue effects.
Fractals are considered complex structures that possess self-similarity at various degrees of magnification. Natural spatial examples of fractal structures include coastlines, snowflakes or tree branchings. No matter the scale or magnification, the essential underlying pattern is similar (Eke et al., 2002). Fractal behavior of the cardiac beat series is characterized as degrees of self-similarity of the beat sequence over different time scales (Goldberger et al., 2002). DFA a1 is based on these fractal cardiac beat arrangements which can also be embodied as “correlation properties” of the pattern over short time spans. To better understand the concept of correlation properties, analogies to a random walk have been used (Hardstone et al., 2012). For example, during a random walk, at each next step, the walker can choose to go either right or left. If the choice the walker makes is not random but based on the previous sequence (series of right or left decisions), the pattern is described as being well “correlated” (DFA a1 near 1.0), since the future pattern is based on the past history. Values above 1.0 denote progressively higher degrees of correlation. But, if each new step is taken with equal, random chances of right or left, an “uncorrelated” pattern exists (DFA a1 of 0.5). During exercise it has been observed that at low intensity, DFA a1 values are usually in a correlated range near or above 1.0 (Gronwald et al., 2020; Gronwald and Hoos, 2020). As intensity rises, DFA a1 declines, passing 0.75 at moderate loads, continuing to drop further past the 0.5 range with increasing exercise intensity (uncorrelated random behavior of interbeat pattern), finally to drop below 0.5 (representing an anticorrelated range) at the very highest work rates. Anticorrelated behavior refers to a pattern that tends to bring the walker back to midline and can be viewed as an immediate self-correction mechanism associated with the potential failure of homeodynamic regulation and can only be tolerated for short time spans (Karasik et al., 2002). These correlation patterns are felt to be due to changes in sinoatrial pacemaker function under control by the balance between the reciprocal branches of the autonomic nervous system (ANS) (Michael et al., 2017). During exercise there is both a withdrawal of parasympathetic and enhancement of sympathetic activity resulting in a change of HRV including DFA a1 (White and Raven, 2014). Therefore, alterations in DFA a1 provide a view of autonomic balance from rest to severe intensity domains. This autonomic based index of systemic internal load contrasts with established markers of intensity that depend on physiologic subsystems such as cardiorespiratory variables (VO2, VCO2), chemical moieties (lactate) and measures of external load (speed/power).
The above was taken from our latest review. The figure below is illustrative of how a1 behaves from easy, moderate, and more severe intensity domains:
.tif)
B: DFA a1 vs HR of three participants during incremental exercise ramps.
- Red circle: 59-year-old male with stable coronary artery disease (CAD), beta blocker usage and a VO2max of 25 ml/kg/min, HR at VT1 of 83 bpm and HR at VT2 of 109 bpm performing an incremental cycling ramp test.
- Blue circle: 23-year-old female triathlete with a VO2max of 60 ml/kg/min, HR at LT1 of 154 bpm and HR at LT2 of 165 bpm performing an incremental cycling stage test.
- Green circle: 19-year-old male runner with a VO2max of 58 ml/kg/min, HR at VT1 of 167 bpm and HR at VT2 of 179 bpm performing an incremental treadmill ramp test.
Can it be used to determine the aerobic threshold and other aspects of exercise intensity? (From Frontiers Review):
Do Specific Values of DFA a1 Correspond to Conventional Physiologic Exercise Thresholds - an initial assessment?
Previous studies exploring DFA a1 behavior through progressive increases in exercise intensity have shown that at workloads near the AeT, index values fall midway between well correlated (1.0) and uncorrelated states (0.5) (Gronwald et al., 2020). Explanations for the association of physiologic breakpoints with correlation properties of HRV can revolve around practical observations (empirically derived from observing DFA a1 vs. VT1/LT1 during exercise ramp or stage studies) but can also be understood from a network physiology standpoint as an integrated concept of ANS regulation during endurance exercise (Balagué et al., 2020; Gronwald et al., 2020). Network physiology encompasses multiple neuromuscular, biochemical, peripheral and central nervous system inputs leading to an overall concept of “organismic demand” that is reflected in correlation properties of HRV and consequently in the response of DFA a1. Therefore, it was conjectured that a specific value of DFA a1 may correspond to the AeT, which would be helpful in sports and exercise science given the importance of this training boundary for intensity distribution models in many fields of application (Gronwald et al., 2020). Whether the desired program is polarized, pyramidal or threshold in type, identification of the low intensity boundary would be necessary (Seiler and Kjerland, 2006; Esteve-Lanao et al., 2007; Stöggl and Sperlich, 2015, 2019; Bourgois et al., 2019). With this objective in mind, the question of whether a value of DFA a1 between correlated and uncorrelated corresponds to the VT1 was evaluated in a group of male recreational runners (Rogers et al., 2021a). Results indicated that reaching a DFA a1 of 0.75 during an incremental treadmill test was associated with the VT1 and termed the heart rate variability threshold (HRVT). While this finding was encouraging, widespread application as an AeT boundary requires support in many demographic groups. Therefore, a very different class of participant, comprising male cardiac disease patients (congestive heart failure, stable coronary disease) was studied using an incremental cycling ramp protocol (Rogers et al., 2021f). During the cycling test the HR and VO2 attained at the VT1 was strongly associated with the HR and VO2 at the HRVT. Finally, in a contrasting population, the HR and cycling power at the HRVT was associated with the HR and cycling power derived from the LT1 in a group of elite triathletes (7 male, 2 female) performing an incremental cycling stage protocol (Rogers et al., 2022a). Although female data on DFA a1 behavior is sparse, the 2 female participants in this group had typical DFA a1 responses to incremental cycling exercise. In addition, it was also hypothesized that another physiologic breakpoint, the AnT, could occur at a DFA a1 of 0.5 (Rogers et al., 2021c). This value is associated with the transition from an uncorrelated to an anticorrelated pattern in HR time series. Since the anticorrelated state is felt to be an autonomic response indicating organismic destabilization (Seely and Macklem, 2004), it could correspond to a parallel phenomenon represented by a loss of cardiorespiratory sustainability. In support of this belief, study results from a recreational runner cohort showed that reaching a DFA a1 of 0.5 was associated with that of the VT2 and termed as the second heart rate variability threshold (HRVT2) (Rogers et al., 2021c). Most recently, a study done by Mateo-March et al. (2022) showed good agreement and correlation with both the HRVT and HRVT2 with lactate derived first and second thresholds in a large group of male professional cycling participants. Although the LT2 to HRVT2 correlation was high (r = 0.93 for cycling power, r = 0.71 for HR) there was a statistical difference in mean values (bias of 8 W or 4 bpm). As in Rogers et al. (2021c), the limits of agreement for the HRVT2 were relatively wide. Further studies should examine this more closely and attempts made to improve individual variations.
Although prior studies indicated that DFA a1 declines as external exercise load rises, none had previously attempted to establish a distinct value corresponding to the AeT or AnT. Part of this difficulty relates to the method of DFA a1 plotting used during incremental testing. In previous work, DFA a1 behavior was routinely assessed by using non-overlapping measurement windows (of 1–5 min) often at the end of each intensity stage or condition of exercise (Gronwald and Hoos, 2020). Therefore, if an incremental exercise test consisted of 9 stages of 30 W per stage (10 w/min rise), only 9 DFA a1 data points would be available. To better detect a more precise pattern in DFA a1 behavior, a different method of DFA a1 plotting was utilized. This technique used fixed measuring windows of 2 min but did a rolling, ongoing recalculation every 5 s of activity (Kubios HRV Premium software “time varying” option: window width of 2 min, grid interval of 5 s). The 2-min time windowing was chosen based on the calculations by Chen et al. (2002) to achieve a sufficient number of RR data points to achieve DFA a1 validity. By using this method, a nearly straight-lined drop of DFA a1 from values of approximately 1.0 to 0.5 became apparent (Rogers et al., 2021a), providing an opportunity for simple linear interpolation of the corresponding HR or time plotted against DFA a1 of 0.75 (see Figure 1). Although not extensively studied, it also appears that constant power cycling intervals with 2-min measurement windows may also be used for HRVT determination (Gronwald et al., 2021). Another group looking at DFA a1 behavior in recreational runners using a 5-min measurement window showed similar correspondence to physiologic exercise threshold results during treadmill intervals with DFA a1 values of 0.68 ± 0.28 for the VT1 and 0.48 ± 0.11 for the VT2 (Naranjo-Orellana et al., 2021). Thus, DFA a1 values of 0.75 and 0.5 may represent a comprehensive solution to accepted physiologic exercise boundaries across a wide spectrum of individuals. In terms of individual participant agreement between HRV and gas exchange/blood lactate derived thresholds, they appear to be of similar magnitude to that of other comparisons of threshold approaches such as blood lactate versus ventilatory parameters (Pallarés et al., 2016), assessment of gas exchange techniques for VT1 determination (Gaskill et al., 2001), comparison of the maximal lactate steady state (MLSS) and functional threshold power (FTP) (Klitzke Borszcz et al., 2019) as well as the muscle oxygen desaturation breakpoint association to the MLSS (Bellotti et al., 2013). Despite the validation with established threshold concepts, it should be kept in mind that the present systemic approach is based on ANS regulation that does not necessarily match perfectly with other concepts based on subsystem parameters.
Reconciling differences in the first threshold (using custom midpoints different from 0.75):
For these surrogate thresholds to be of realistic use, good agreement to existing standards as well as day to day repeatability needs to be present. Studies by multiple groups using both cycling and treadmill models have shown encouraging results supporting the second HRV threshold (HRVT2, DFA a1 value of 0.5) as a viable marker of the respiratory compensation point (RCP) or second lactate threshold 10–15. Additionally, DFA a1 behavior at constant power 16, during replicate ramp incremental testing 14,15 and over differing ramp incremental slope protocols 17 has been shown to be reliable/repeatable. However, in the case of the first HRV threshold (DFA a1 value of 0.75) agreement with the gas exchange threshold (GET) or first lactate threshold, results are somewhat conflictive. Although HRVT1 has been demonstrated to have strong correlation and minimal bias to different markers of the first threshold during incremental tests on the treadmill 18,19 or during cycling exercise 11,20, other studies have not shown such agreement. For example, a report comparing different ramp incremental slopes 17, three studies involving cycling 12,14,15 and one composed of only female participants 21 have been consistent with an overestimation of the first HRV threshold in comparison to traditional markers of the first threshold. However, even though the first HRV threshold was overestimated in some of these these trials, the reliability/repeatability was still good 14,15. Another situation that could theoretically lead to HRV threshold divergence is that of participant fitness status. However, this does not seem relevant as studies with high athletic fitness show both good agreement11,19,20 and poor agreement14 with GET or first lactate thresholds. It should be noted that DFA a1 including the first and second HRV thresholds can be affected by HRV artifact correction, recording device, sensor lead placement and preprocessing software 3,22 which could potentially affect results. However, careful examination of studies evaluating the first HRV threshold to gas exchange or lactate-derived indicators generally employs similar methodology, artifact correction and are even authored by similar research groups.
To explore why these differences in the first HRV threshold to the GET or the lactate threshold agreement may occur, an examination of the reasoning behind the HRVT1 concept is in order. DFA a1 correlation patterns are thought to be due to changes in sinoatrial pacemaker function controlled by the balance between the branches of the autonomic nervous system (ANS) 23. During exercise there is both a withdrawal of parasympathetic and an increase of sympathetic activity resulting in a change of HRV including DFA a1 24. Past studies demonstrated that during a ramp incremental test, values were well above 1.0 at very low intensities (well correlated), moved through a “partially” correlated (±0.75) region at moderate intensities, passed the “uncorrelated” value of 0.5 near the heavy/severe intensity boundary, finally reaching values below 0.5, signifying an “anticorrelated” pattern at severe intensities 25. It was posited that at the first threshold, the cardiac beat pattern would be found in an intermediate zone between well correlated (DFA a1 ≥ 1) and uncorrelated (DFA a1 = 0.5) behavior, which was numerically set to 0.75 7. In addition, it was conjectured that the second threshold would correspond to a second DFA a1 threshold of 0.5 (HRVT2), which represents a random interbeat pattern 10. DFA a1 values below 0.5 correspond to “anticorrelated” patterns representing an autonomic response indicating organismic destabilization consistent with exceeding a metabolic steady state 5,26. More careful inspection of prior data indicates that some individuals have a DFA a1 well above 1.0 early in the ramp incremental, with these values still considered strongly correlated 27. Since the initial DFA a1 in some individuals may be higher, the midpoint between well correlated and uncorrelated values (defining the first HRV threshold) in these cases would be shifted to a higher DFA a1 as a mathematical correction. For example, if an individual had a DFA a1 of 1.5 early in the ramp incremental, the midpoint denoting the first HRV threshold would be 1.0 with the associated HR and V̇O2 calculated accordingly. This suggests that the lack of agreement that some studies observed between the physiological responses observed at the first threshold might be explained, at least to a given extent, by the methodological approach used for the first HRV threshold determination.
The purpose of this study was to explore the effects of modifying the value of DFA a1 used for determining the oxygen uptake and heart rate associated with the first HRV threshold, from a fixed value of 0.75 for all participants, to that of one based on individual DFA a1 ramp characteristics. Findings indicate that by using a custom first HRV threshold derived from the DFA a1 value midway between the maximal seen during the early portion of the ramp incremental and 0.5, the positive bias of HR and V̇O2 observed using the conventional HRVT1s was eliminated. Furthermore, since the line of regression used for determining HRVT1c was unchanged from standard methodology (Figure 1), the tight relationship between the HRVT2 and RCP was maintained.
HRVT1s vs HRVT1c agreement to the GET
As in some previous reports, the V̇O2/HR seen at the HRVT1s was substantially higher than the GET V̇O2/HR 12,14,15,17. This bias was virtually eliminated by individually defining each participant’s DFA a1 predicted to correspond to the GET, with no differences in group mean HRVT1c V̇O2/HR comparisons to GET V̇O2/HR. Additionally, there was a reduction in the LOA (for example LOA reduced from a range of ±35 to ±26 bpm for HR), with trivial bias in the V̇O2/HR associated to HRVT1c compared to the V̇O2/HR responses associated to the HRVT1s (Figure 3). In terms of group correlation to the GET V̇O2/HR, both HRVT1s and HRVT1c showed similar strength in Pearson’s r and ICC to prior studies11,15,18,19,21 (Figure 4). Equivalence between GET and HRVT1c V̇O2/HR was also verified (Figure 5). Mean Max DFA a1 during the ramp incremental was 1.5, resulting in a calculated HRVT1c threshold near 1.0. These observations support the hypothesis that a given individual’s DFA a1 ramp incremental midpoint between well correlated and an uncorrelated pattern does not necessarily occur at a value of 0.75. In past studies, early ramp incremental DFA a1 values were not systematically provided. However, it is of interest to highlight a group of participants that showed both good agreement of the HRVT1s to the GET and also had DFA a1 recorded during a low intensity warmup pre-ramp 16,19. The mean DFA a1 during the pre-ramp warmup was 1.12±0.23 (corresponding HR = 141±13), making the calculated DFA a1 at HRVT1c of 0.81 and standard HRVT1s of 0.75 almost the same. Thus, as with the current report, matching the V̇O2/HR to the calculated DFA a1 ramp incremental midpoint resulted in good first HRV threshold to GET agreement via mathematical adjustment of first threshold targets. Furthermore, the high day-to-day reliability 16 of each participant’s warmup DFA a1 (ICC = 0.85) and the repeatability of the HRVT214,15,17 adds confidence to the notion that midpoint calculation might be a repeatable occurrence.
HRVT2 vs RCP agreement
There was good agreement between the RCP V̇O2/HR with that of the HRVT2 V̇O2/HR in terms of group mean values (Table 2), minimal bias, moderate LOA (Figure 3) and high degrees of correlation (Figure 4). This was not unexpected as the recording device, procedures, calculating software and plotting methodology were the same as in previous reports which indicated similar findings 11–14,21. However, it was important to present this data not only to corroborate previous results, but also to highlight that there is no alteration in the derivation of the HRVT2 as a significant advantage of the proposed HRVT1c modification.
Contrasting ANS vs cardiorespiratory thresholds (yes, this is important to understand)
While the use of a custom HRVT1c calculation did improve overall agreement with the GET, variation still exists on an individual basis. This may partially relate to the underlying conceptual differences between a marker of ANS response and measures derived from gas exchange indicators such as V̇O2, V̇CO2 and ventilatory responses which may diverge in some individuals. HRV in general arises from the competing influences of the stimulatory sympathetic and inhibitory parasympathetic branches of the ANS on the sinoatrial node resulting in fractal correlation behavior of the cardiac beat sequence 23,24. It is theorized that a potential rationale for this behavior is an attempt by the cardiovascular system to best cope with a rapidly changing environment 4,32,33. These environmental changes affect multiple neuromuscular, biochemical, peripheral and central nervous system inputs leading to alterations in “systems integration”34. Within this framework, various physiologic responses and cardiovascular advantages may exist behind the changes seen in correlation patterns due to increasing exercise intensity and overall organismic demands35. Therefore, at low to moderate exercise intensity where future physiologic requirements may be quite variable, cardiac ANS measures consistent with plasticity/flexibility are preferred (DFA a1 is correlated, 0.75 ≤ n ≤ 1.5) but these same measures becomes more rigid (DFA a1 is uncorrelated/anticorrelated, ≤ 0.5), in the heavy to severe domain as an ultimate protective response 32,36. Anticorrelated behavior refers to a pattern viewed as an immediate self-correction mechanism associated with the potential failure of homeostatic regulation and can only be tolerated for short time spans, in agreement with the severe intensity domain 26. Consistent with entering this metabolically unstable zone, it has also been shown that DFA a1 drops to below 0.5 in normal volunteers during high dose norepinephrine infusion 37. An analogy to these correlation behaviors could be optimization strategies employed by a soccer goalie. During most game play, the goalie would maintain a flexible approach, able to respond to highly variable threats (as with the HRVT1c). Under more critical circumstances, as in an imminent scoring opportunity, the choice of goalie position would be greatly constrained to prevent a catastrophic response (as with DFA a1 ≤ 0.5). The consequence of these conceptual differences in correlation properties (flexibility vs rigidity) is that the first HRV threshold may need to be mathematically realigned to account for individual variability in the DFA a1 ramp incremental range, as done in the present report.
Experimental considerations
As previously discussed, many circumstances can alter DFA a1 determination and the resulting HRV thresholds including prior fatigue, software preprocessing (detrending), ECG/RR artifact correction, recording device bias and chest belt placement 3,22. Additionally, little data exists comparing ramp incremental derived HRVTs with that of DFA a1 during constant load exercise. It has been recognized that lengthy time spans at low intensity 38 or short time spans at high intensity 19 can suppress the DFA a1 that would otherwise be expected. As a consequence of the different underlying physiological concepts involving cardiorespiratory thresholds and markers of ANS status, individualistic differences may remain between the GET/RCP and ANS linked HRVTs even with further advances in HRV methodology. Continued research into combining other noninvasive surrogate markers with the HRVT such as muscle NIRS desaturation breakpoints 13, or ECG derived respiratory rate thresholds 12 appears reasonable despite the increased cost or complexity involved. Additionally, even established methods such as gas exchange based respiratory responses have both error, device bias and day to day variations to some degree39. With regards to equivalence testing, setting different boundaries for Cohen’s d could affect these results.
Practical Applications
The results of this study refine and support the original hypothesis that the V̇O2/HR found at the GET would correspond with that of the DFA a1 seen at a midpoint between well correlated and uncorrelated values. However, instead of a fixed midpoint value of 0.75 used for all circumstances, the novel finding presented here indicates that this target needs to be derived from the maximum DFA a1 seen early in an individual’s ramp incremental. Therefore, by simply altering a single facet of the first HRV threshold computation, we can resolve the differences between conflicting study outcomes such as the poor GET to HRVT1s agreement in this data set with that of the stronger agreement seen by Van Hooren et. al. 19. However, even with the HRVT1c adjustment, underlying differences between ANS vs cardiorespiratory responses may preclude exact agreement between HRV related thresholds and established standards.
Conclusion
An individualized first HRV threshold estimate based on the V̇O2/HR occurring at the DFA a1 midpoint between that observed early in the ramp incremental and an uncorrelated pattern showed greater agreement to the GET than the conventional methodology using a fixed DFA a1 of 0.75. Mean values for GET V̇O2/HR and that of HRVT1c derived values were in closer agreement than what was observed using the standard approach. Application of this refinement to existing methodology will hopefully resolve conflictive first HRV threshold study outcomes, while preserving the already established RCP to HRVT2 relationship.
How accurate is it for threshold identification?
- Before answering, we need to think about how accurate the comparison "gold standards" methods are. As discussed in the articles above, there are real issues in both lactate and gas exchange tests, making them subject to various errors and inconsistencies. Some gas exchange results are so confusing that they are not interpretable. Machine-based gas exchange results are not always accurate. From the limited study data so far, it seems the DFA a1 is a reasonable surrogate for the AT.
- For specific detail, see the published refs below.
What sports can this be applied to?
- This is a good question. So far, only running and cycling have been well explored. Other activities such as those using upper and lower extremities (xc skiing, kayaking, rowing) may not follow the same relationship with the AT.
What can affect the numbers I get?
- A very wide range of factors. Stress, heat, caffeine, caffeine withdrawal, food, fasting and over-training are some of the factors before we even process the data. Preprocessing algorithms, software settings, are also critical. Kubios may give different results from a python based method. We will need to do formal comparison testing between Kubios and python methods eventually.
- Should I use a fan indoors - YES -
Another look at indoor exercise without a fan
Do I need clean, artifact free data?
- An important factor that will affect the DFA a1 is artifact in the RR series. Missed beat artifact is the most common, and if above 3% could, but if above 6% will affect the values you get. A single APC may also dramatically drop the DFA a1 for that window of measurement. Correction methods help with this but are not perfect. One of the strengths of our initial Frontiers study was that we used ECG data with almost no artifact. YMMV using a chest belt with artifact.
- We recently had an article published in the journal "Sensors". Below is the abstract from that study:
Recent study points to the value of a non-linear heart rate variability (HRV) biomarker using detrended fluctuation analysis (DFA a1) for aerobic threshold determination (HRVT). Significance of recording artefact, correction methods and device bias on DFA a1 during exercise and HRVT is unclear. Gas exchange and HRV data were obtained from 17 participants during an incremental treadmill run using both ECG and Polar H7 as recording devices. First, artefacts were randomly placed in the ECG time series to equal 1, 3 and 6% missed beats with correction by Kubios software’s automatic and medium threshold method. Based on linear regression, Bland Altman analysis and Wilcoxon paired testing, there was bias present with increasing artefact quantity. Regardless of artefact correction method, 1 to 3% missed beat artefact introduced small but discernible bias in raw DFA a1 measurements. At 6% artefact using medium correction, proportional bias was found (maximum 19%). Despite this bias, the mean HRVT determination was within 1 bpm across all artefact levels and correction modalities. Second, the HRVT ascertained from synchronous ECG vs. Polar H7 recordings did show an average bias of minus 4 bpm. Polar H7 results suggest that device related bias is possible but in the reverse direction as artefact related bias.
So what does this mean on a practical basis? Anything with >6% artifact in the area of interest should not be trusted. Since both the Kubios threshold correction method, Runalyze, Fatmaxxer and HRV logger use similar techniques, 3% or less artifact containing data will provide reasonable HRVT accuracy. There is also a chance that 3-5% artifact containing data series will be fine, but you may want to re test yourself. The effect of missed beat artifact on DFA a1 is to artificially raise the computed value at low DFA a1 ranges (not high ranges). For example, if the DFA a1 was .5 with no artifact, after adding 6% missed beats with correction (by Kubios), the software will output .65 +-.
Here is a look at how that works out on a Bland Altman assessment

The solid line is the "average" difference between methods, notice how this process is dependent on what DFA a1 actually is. There is minimal "bias" between DFA a1 of 1 and .5 which is important for the HRVT. However, values below .5 are very much altered.
- Also see below under recording devices.
- It appears the greatest source of missed beat artifact is the use of AnT+ data transmission in a Garmin device.
What artifact correction settings do you recommend?
- If you are using the Kubios paid premium version, use the "auto" method. Free version Kubios uses the threshold method (similar to HRV logger, alpha HRV, Fatmaxxer and Runalyze). The medium correction setting is the default and should work well (similar to the 20% setting in FM, Runalyze). The exception is with an APC where a sudden drop is seen. Using the extra strong filter setting (or the "work out mode" in Logger, 5% or auto in Fatmaxxer) will filter out the APC but can also filter some physiologic beat to beat variation. Get a feel if you exhibit frequent APC activity, and if so, use the more aggressive settings. IMO, Fatmaxxer and alpha HRV have the best method - automatic alteration of threshold mode as HR rises.
Does recording device matter?
- The above validation study was done with a research grade ECG. It is very possible that a chest belt device will detect R peaks differently as well as be affected by preprocessing issues. Interference with either chest wall or diaphragm related activity can change the ECG waveform. Disturbance of the pattern of self similarity would then occur after the introduction of this type of distortion. However, the Polar H10 results appear very close to accurate waveform ECG derived values.
- Also see this: DFA a1, Sample rates and Device quirks
In the Sensors study, we found that the Polar H7 "measures" DFA a1 as slightly lower values. This is in the opposite direction as what missed beat correction induces, which is actually quite convenient! The end result of a Polar H7 recording with 3-5% missed beat correction may yield values that are very close to those of an ECG. Below is a figure from our article that shows this very nicely. The Polar reads lower than the ECG, but the 6% artifact recording reads high - making for a "self correcting" effect. If you had a Polar RR series with no artifact, yes, you might have bias. We are continuing to look into this.
Time-varying analysis (window width: 120s, grid interval: 5s), DFA a1 for matched time series containing no artefact in one representative participant, ECG (solid triangle), Polar H7 (open circle), ECG 6% MC (open triangle).

I have the option of recording HRV either using ANT+ or bluetooth - is there a difference?
YES and No
- Although I initially couldn't believe this should make a difference, it apparently does! Here is an experiment I ran. The first tracing shows a recording using a Polar H10 to my Garmin watch using Ant+. The second is a recording of the same power/duration/conditions on another day using bluetooth (same H10, same watch).


- There are clear differences - the bluetooth tracing has zero missed beats (one APC noted), but the ANT+ recording has many (the vertical lines). This has been replicated many times and is reproducable.
- Bottom line - if you are seeing many artifacts using ANT+, try switching to bluetooth.
- However, the new alphaHRV app for Garmin devices uses it's own Ant+ protocol and is not subject to direct Garmin watch limitations. Garmin apparently uses a lower sample rate firmware for Ant+ to save battery which is the issue with accurate RR at high HR.
If I shouldn't use ANT+ then how can I get the RR data to both my Garmin watch/head-unit and Fatmaxxer during an exercise session?
- The Polar H10 has a nice feature that enables two different devices to simultaneously receive RR packets over bluetooth. It is not enabled by default so you will need to do so. The instructions are here.
- Once enabled you can have your Garmin watch and the appropriate app (or other bluetooth device) receive data at the same time. But remember, other nearby receivers may be able to pick up your data and see your stats. This applies to ANT+ as well. Using the Polar Beats app, you can turn off multi device bluetooth and/or ANT+ at will.
- If the H10 is already added as an Ant device in the Garmin unit we need to get rid of it - first - delete the Ant device from "Sensors", Go to - add new external HR, but don't add the Ant, the Garmin will then ask to search bluetooth, say yes and add the bluetooth HRM.
- Note - on H10 battery change (or pull) these settings will be lost! You will need to reapply with the Polar app.
I don't want to deal with Kubios, is there a low cost, easy option for DFA a1 tracking?
- Absolutely! Please see this for the app matrix

- Runalyze/AIendurance are able to automatically transfer your Garmin fit file recording and display DFA a1 over time and also compare it to HR and power. They will automatically calculate a aerobic threshold as well. See this post for further details - Best practices for Runalyze and DFA a1 thresholds
- Fatmaxxer, is an app designed as a dedicated DFA a1 monitoring tool for android. This is my choice as the option for real time a1 tracking. Reasons include the ability to track DFA a1 at an every 5 second refresh rate and ECG strip recording of artifacts. What does this mean? We can get a fine/granular plot of DFA a1 over time with points every 5 seconds. If an artifact is detected, a separate file is saved with that data to graph and inspect. It also seems to have the best a1 accuracy compared to Kubios software at this time (using the same detrending method as Kubios). See below


What is the accuracy issue with HRV logger?
- Update 3/23/22 - As discussed in this post,
alternate preprocessing methods other than the type used in Kubios
(detrending method - smoothness priors) may lead to DFA a1 results that
are different than seen with Kubios software. HRV logger does use an alternate method. Therefore,
results may not agree well with published studies. If possible, a secondary check using Runalyze, AIenduance or Fatmaxxer is recommended.
Have any of the apps been formally evaludated?
- Yes - Formal validation of Fatmaxxer published in the European Journal of Applied Physiology Please see the link for details
- No other app to date has been peer reviewed.
Is there a Garmin data field I can use for DFA a1 recording and display?
Can I do a short, fast, rapid rise ramp?
- Just perform a typical ramp of 5 to 30 watts per minute in Zwift. Try not to include the warmup, or post ramp data. Here is a guide for Runalyze ramping.
- Sure - just plot the DFA a1 and HR in the "Features" file.
- Over a series of many "agreement" comparisons, Fatmaxxer appears to track very closely with Kubios HRV software.
How do I reproduce your study protocol (this includes the newer custom HRVT1 method)?
- RR Measurements, HRVT1s, HRVT1c, HRVT2
Each participant's RR time series was recorded by a Polar H10 strap (Polar Electro, Kempele, Finland). The Polar strap electrodes were covered with conductive gel and firmly fitted to the subpectoral area with the module centered over the sternum. Before testing, the Polar H10 ECG waveform was visually evaluated with the Android app ECG Logger (https://ecglogger.en.aptoide.com/app). To optimize DFA a1 measurements, the strap was shifted slightly to the left if the R peak amplitude was lower than the S wave3. H10 data was transmitted through Bluetooth to an Android smartphone using the ECG Logger app for recording both RR intervals, ECG and time alignment for further analysis.
Thresholds corresponding to HRVT1s, HRVT1c and HRVT2 were calculated by a third evaluator who was blinded to the gas exchange and ventilatory data results. RR data previously recorded for each participant were imported into Kubios Scientific HRV Software (Version 4.1, Biosignal Analysis and Medical Imaging Group, Department of Physics, University of Kuopio, Kuopio, Finland). Kubios preprocessing settings were set to a detrending method of “Smoothness priors”, with the smoothing parameter at 500, and the cutoff frequency at 0.035. DFA short-term fluctuation window width was set to 4 ≤ n ≤ 16 beats18. Visual inspection of the entire test recording was performed to determine sample quality, noise, arrhythmia, and missing beat artifact. The RR series of each participant was corrected by the Kubios “automatic method” and DFA a1 was calculated every 5 seconds with 2-minute measurement windows and results exported as text files for further analysis. Acceptable percent artifact occurring during threshold interpretation segments was set to below 5% 22.
Plotting of DFA a1 vs HR was performed for the determination of HRVT1s HR and HRVT2 HR as seen in Figure 1 and detailed previously18. HRVT1s HR defined as the HR where DFA a1 equaled 0.75 and HRVT2 HR defined as the HR where DFA a1 equaled 0.5 18.
The HRVT1s and HRVT2 V̇O2 was derived via the DFA a1 vs time plot. The times that DFA a1 reached 0.75 (HRVT1s) and 0.5 (HRVT2) were used to then derive the V̇O2 via the V̇O2 vs time relation based on gas exchange and ventilatory analysis 18.
The determination for HRVT1c HR and V̇O2 was identical to the above, except that instead of specifying DFA a1 = 0.75 as the first threshold, each participant was assigned a custom value. The HRVT1c custom value was defined as the midpoint between the maximal DFA a1 (Max DFA a1) value seen in the early portion of the ramp incremental and 0.5. This maximal value was always below 3 SD from the running 45 second local mean value. For example, if the maximal value during the early ramp incremental portion was 1.5, the corresponding V̇O2/HR HRVT1c was based on a DFA = 1.0 (midway between 1.5 and 0.5) as seen in Figure 1.
Can I do a short, lower intensity ramp to determine the HRVT2?
- Yes! - See Predicting the max metabolic steady state with submax HRV
- In this case, a ramp to an intensity where a1 = 0.75 seems able to predict where the 0.5 HRVT2 will occur.
How do I make sure I'm really doing a recovery ride on my rest day?
- This is an ideal scenario for the the real time apps. Just watch the live read out and keep DFA a1 above .8 or even .9 (yes .75 is the cutoff, but there is individual variation and a small buffer is advised). A single value that falls below .75 then normalizes where it started again was probably due to an APC.
- To train hard or not, that's the question
Are my values going to be the same day to day?
- Probably not. Although they may be close, it's normal and expected to have some shifting in heart rate or power on a day to day basis. This would be the case with gas exchange or lactate as well. As stated above, other factors will change the index result, especially heat, skin temp and humidity.
- Some new study data on rest and exercise related a1 reliability (repeatability) is published here :
While there is an expected variability for day to day results, they are relatively small. From the discussion - With this approach, an athlete performing multiple standardized warm-up sessions would need to exhibit a change in DFA-a1 larger than 0.18–0.21 to be considered as a worthwhile change.
Can the intensity of exercise where DFA a1 = "x" be used as a way of tracking fitness changes after training?
- Possibly and I will update when I am able.
I'm on beta blocker therapy, will this change the DFA a1 to intensity relation?
Why are my DFA a1 values too high for the level of effort I am doing?
- The most common reason would be the effects of high rates of missed beats in the RR sequence. Kubios will give you artifact rates - you should not trust rates beyond 5% as per our Sensors study.
- Different detrending method used. This is possibly why Fatmaxxer, Runalyze and AIendurance are the most accurate (in my hands) options aside from Kubios.
- Update 3/23/22 - As discussed in this post,
alternate preprocessing methods other than the type used in Kubios
(detrending method - smoothness priors) may lead to DFA a1 results that
are different than seen with Kubios software. HRV logger does use an alternate method. Therefore,
results may not agree well with published studies. If possible, a secondary check using Runalyze, AIenduance or Fatmaxxer is recommended. Alpha HRV for Garmin uses an alternate detrending but after extensive testing I can say that it appears to closely resemble Kubios.
Can I improve the DFA a1 threshold agreement with established methods?
Absolutely - see the citations below
- Combining NIRS and DFA a1 for critical intensity estimation
- A new paradigm for Intensity thresholds - combining surrogate markers
Where does the DFA a1 value of .75 actually come from? Why doesn't it vary person to person?
- Initially, the .75 value was "guesstimated" from data showing that DFA a1 runs about 1 during very light exercise (representing very correlated/self similar patterns) but drops to .5 (corresponding to random beat patterns) at very high intensity.
- However, after working with other research groups and populations, I advise using the "custom" midpoint method for HRVT1 but maintaining the HRVT2 target of a1 = 0.5
I've noticed that I can't drop my a1 below .5 using the HRV logger, any ideas.
- Yes - see this
DFA a1 agreement using Polar H10, ECG, HRV logger - And the difference detrending makes
- Use a more precise app such as AI Endurance, Fatmaxxer or Runalyze
- Update 3/23/22 - As discussed in this post, alternate preprocessing methods other than the type used in Kubios (detrending method - smoothness priors) may lead to DFA a1 results that are different from seen with Kubios software. HRV logger does use an alternate method. Therefore, results may not agree well with published studies. If possible, a secondary check using Runalyze, AIenduance or Fatmaxxer is recommended.
- As stated, high amounts of artifact correction can bias the a1 upwards.
I've noticed that my a1 drops too quickly and the thresholds are too low.
Several issues can lead to premature a1 suppression, including:
- Fatigue, illness, stress. Do not test if you are not well rested unless you want to see the effects of fatigue on the ANS.
- Uncorrected premature beats (beats that slip through the correction algorithm)
- Older HRMs such as Polar 800 series
- Poor ECG R peaks - I highly recommend measuring your R peak, as we do in our recent papers. In addition, I would be leary of publications that did not verify optimal HRM positioning (see bottom of page).
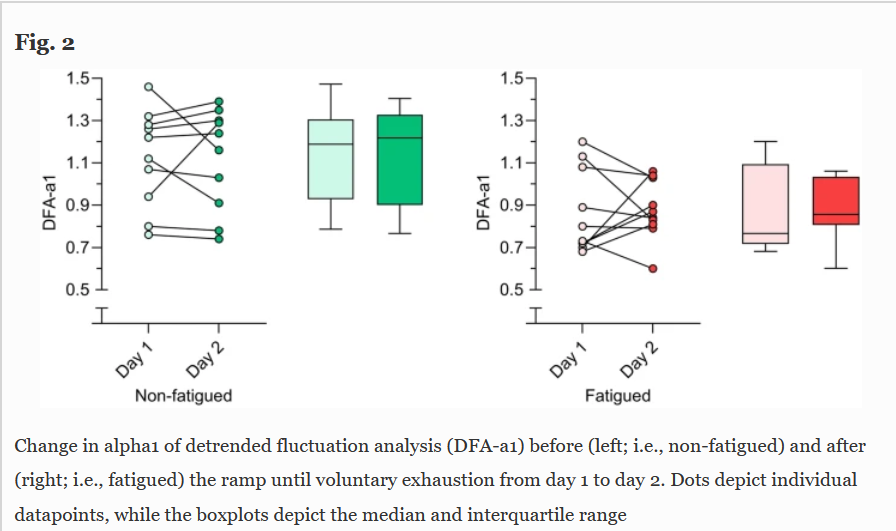
Can DFA a1 be used as a marker of fatigue?
- Yes, here is a recent publication addressing this - DFA a1 and Respiratory rate as measures of Durability
- In addition, The usual pattern of DFA a1 behavior may be shifted after a session of fatiguing exercise. This can also be used as an indicator of "training readiness" in lieu of resting HRV. For instance, if you see that your a1 is running lower than it should in the warm up period of your session, that may indicate that you are still recovering from a previous stressful set of session.
- See the AIEndurance web site for their implementation of this concept
- To train hard or not, that's the question
Does the HRVT change if I'm sick?
- It probably depends on how ill you are - anecdotal reports have appeared showing substantial a1 suppression at low exercise intensities.
- Given the known effects seen with fatigue, it would make perfect sense for the a1 to be lower than normal during or immediately after an illness.
- A recent observation I made might shed some light. I did a 20 minute Zwift ramp (130 to 230w) the morning of my second Moderna Covid vaccine (Pre) and another the next morning afterward (Post). Yes, I had the typical post vaccine sore arm, nausea, fatigue, muscle pain and was really "spaced out". Like the flu but no sore throat or congestion. Did the HRVT change? Very surprisingly it did not:

Why does my DFA a1 seem lower (for a given HR) running vs cycling?
Several potential reasons:
- Random differences and day to day variation - try to repeat the tests on a regular basis to see if it is real.
- Potential loss of R peak precision. What I have found is that in certain people (a minority) some electro-mechanical factor creates some distortion of the R peak. This may be diaphragm related but more likely trunk musculature that is firing more strongly while running. If you wore the Movesense ECG you may see this:


- Since the DFA a1 is related to "correlation" of beat patterns, having a loss of precision of those patterns by distortion of the R peak will reduce the value seen. This was nicely demonstrated by Dr Mourot's study
- This will not affect the HR since the same beat count per time is present. It also is not noticeable at rest since those offending muscles are not firing.
- If you see a large discrepancy and don't have the ECG to confirm why, trust the bike data over the run until we get more information on this problem - again, it occurs but not in everyone. This is a discussed here.
Does the position of the HRM belt matter?
- It certainly can!! Please see these posts for details
- DFA a1 and optimal HRM belt position
- Pitfalls in DFA a1 - Polar belt position
- More issues with belt position
- Even Polar recommendations that belt placement modification is required in many cases

Can the index be used for monitoring endurance and HIT fatigue
- It seems possible - see my N=1 data
- As noted, don't look for the HRVT after a HIT interval or post a long exercise session.
- See also - DFA a1 stability over longer exercise times - yes it appears to be "stable for long durations (1-2 hrs) as long as pace is below the aerobic threshold.
- Study in an ultramarathon model - this is the foundation for AIEndurance metrics of readiness to train and durability. We are currently exploring this as a research project and hope to have data shortly.
Can I get a single lead ECG from a Polar H10 sensor?
- Here is a guide
- Or, just the artifact sections - ECG artifact strips from Fatmaxxer - a guide
Is the HRVT concept valid in non athletes or those with cardiac disease and beta blocker therapy?
- See this article - DFA a1 threshold in a cardiac population
- Recently, I've discussed the novel concept of combining two (or more) surrogate measures into a single averaged value. This type of procedure could potentially be done with other surrogates as well, as discussed in the linked post.
- If you are truly interested in achieving a closer agreement with VT1/VT2, consider jumping down the rabbit hole of dual surrogate markers.
- Combining NIRS and DFA a1 for critical intensity estimation - this is a must read for best estimation of the VT2/RCP/MLSS
- NO! - see this post for details
- As part of the discussion, I recommend only using devices with proven validation (Movesense Medical ECG or Polar H10) for measurement.
What would be a good power between “steps” using HRV logger and the six minute long steps? 10 watts? 20 watts?
ReplyDeleteI think 20 watts should be fine. Once you get your approximate threshold, you can retest by just doing 3 stages, AT-20, AT and AT+20w.
ReplyDeleteHey Bruce,
ReplyDeleteGreat blog! I am a nephrologist passionated about endurance training :-). I even did some of my training in Gainesville back in 2005-2007!
I am going to try to use DFA a1 to estimate my LT1 tonight!
Thanks for sharing the information.
Thank you for your kind remarks, glad this method may be of help to you. And yes, greetings from Gainesville!
DeleteBruce, thank you for your work, so helpful. I'm using HRV Logger, Kubios-free and runalyze to establish my LT1, using your protocol: 20' wu, 6' steps with 0.3 km/h increments. I noticed that DFA cross .75 value, but then rises up, for 20/30 minutes (even if HR, speed and fatigue is high) Actually it seems that 133 bpm and 156 bpm are my aerobic threshold. I know it is very weird, can you hepl me to interpetrate ?
ReplyDeleteCould you send a dropbox link to the rr data so I can take a look?
DeleteNo problem
Deletehttps://www.dropbox.com/s/rsdxkpxs3upegrn/2021-3-7_RR_Calcolo%20Lt1.csv?dl=0
I have also all the files exported via HRV Logger
Thanks, ignore the early dip, analyzed and put on twitter
DeleteThis comment has been removed by the author.
ReplyDeleteHi Bruce, thanks for replying on Twitter, really appreciate it. However, 140 characters is just not enough.
ReplyDeleteI'm really enthused by the science of DFA alpha 1 and have just listened to the Endurance Innovations podcast where I'm very pleased to say I understood all of what you said.
One question came to mind while I was listening (and cycling), what would be the effect of wearing 2 HR straps simultaneously? Have you ever tried this?
Also, I was going to do the testing sessions as workouts in TrainerRoad but now I'm thinking that I'll keep it simple and just send a workout to my Garmin and do it from there. This way it will keep the connections to devices to a minimum (Garmin, TrainerRoad, smart trainer, Android app would all need to be used otherwise). I assume you would concur with this approach.
Thanks for the kind words. Although 2 straps can be used, if they end up bumping together that could produce artifact which we want to avoid. Your best bet (and what I do) is use a Polar H10. You have 1 bluetooth to Garmin (that's what I use for kubios), 1 bluetooth to another device for accurate RR (I use HRV logger realtime), and unlimited Ant+ (trainer road, zwift, android ipbike etc).
DeleteYes I wish I'd bought the H10 now for that reason but didn't give enough thought to how I'd connect and to how many devices etc. Ah well, I'll manage.
ReplyDeleteGood blog and information. I started using the hrv logger, 3 days ago and I think my LT1 is 133bpm. As I trained in the mountains I accumulated a lot of fatigue and I think that at 155 bpm the value of alpha 1 appears 1.20. I encountered the same problem. Can you help me?
ReplyDeleteThanks, not sure I totally understand. But after HIT or long rides, all bets are off on a1 thresholds. It will seem lower than usual at a given power. Remember to discard data if artifacts are above 5%
DeleteThanks 🔝
DeleteI saw in hrv logger the artefacts are above 5%. In relation to my doubt it is in trail running, when I start on the flat the alpha 1 is 0.75 {133bpm} but when I go up, logically my hr goes up {155bpm} and my alpha 1 is 1.20. I think more beats per minute my alpha 1 goes down, if the exercise is more intense
Artifact correction can raise the a1, especially if the a1 is around .75 or lower. So if you hit a1=.75 at a HR of 133, then starting getting >5% artifact at higher HR, the a1 would rise erroneously from the artifact correction effect.
DeleteNow I get it!
Deletewhat is your opinion about a protocol before a 50k test with 2500d +? In the warm-up before the race some run with increment?
Other things, I train a lot my MFO {max fat oxidation), the intensity of a1=0.75,is the point of fat max? thank you very much from Portugal - Porto, send my our address and I sent to you a bottle of port wine
Ha, thanks, my reward is seeing you get the hang of this. As far as training, that's a tough one. I'm not a coach and I'd hate to give you the wrong info.
DeleteGreat work on all of this! I am trying to work on the difference between my a1 running and cycling. I see your comments above. How would walking come in to this? I noticed today on a run, that when I was walking up a hill, to keep my heart rate the same as when running, a1 went up to what seemed a more appropriate level (generally it is too low running - around 20 BPM below cycling). Would the difference between running and walking fit with your theory as to why there is a discrepancy?
ReplyDeleteYes, good observation. Walking up a steep grade or even a stair stepper would be a good way to estimate your running threshold. It seems that the act of foot strike/body impact creates some electro mechanical artifact causing loss of R peak precision, resulting in a low a1 (loss of "correlation" patterns)
DeleteGreat thanks. I have a stepper so will give it a go!
DeletePlease let me know how it goes.
DeleteI did a test today on a stepper (actually it is an elliptical trainer so uses arms as well). I did 4 min warm up and then 4 mins ramps trying to keep HR at 115, 120… to 145. I then did exactly the same test on a treadmill. The a1 results seem very different and a bit strange!. For the stepper, a1 never got down to 0.75, with the lowest being 0.9. For the treadmill, a1 was never above 0.75 (except for the warm up which was partly walking). Using a Polar H10, data doesn’t look too messy. I am looking at the data in Runalyze and Kubios (free) so difficult to do direct time comparison other than in the 4min blocks. So, for me definitely seems to be a problem looking at a1 when running. Not sure why I wasn’t seeing a1 going below 0.75 on the stepper. You are welcome to the FIT files if any use.
DeleteThat's exactly what I'm looking for. If you could send me a dropbox link to the fit files I can do a formal comparison and post that here. I did a podcast a couple of days ago and part of the discussion was on the issue of early a1 drop in some runners. Thanks.
DeleteI listened to the podcast, very interesting. Link is https://www.dropbox.com/sh/0xtctaiyyglg6sw/AACflqzlutKBxeBwuEj_0UdYa?dl=0
DeleteIn case it is useful for comparison, I have also uploaded a bike test I did a couple of weeks ago. This was 10 min warm up , then 5 bpm heart rate ramps of 6 mins, to 120 bpm to 150bpm with 8min warm down
DeleteGot them, will work on a formal comparison and let you know shortly - thanks! Yes, the bike is very helpful.
DeleteHere we go - http://www.muscleoxygentraining.com/2021/03/dfa-a1-problems-during-running-why.html
DeleteGreat thanks! Really interesting. I am still surprised that the Stepper results seem higher than I would expect. I have been doing MAF training for the past 5 years or so and my MAF is around 130 which always felt right and I had assumed that things would align around there somewhere. Guess I just keep exploring! Keep up the good work.
DeleteI got an H10 and cannot get a stable DFA a1 while on treadmill (seems too low, I have to walk to stay above threshold) While on a smart trainer I cannot Get it under 0.90 until I am at 160bpm, 91% of my HRmax (i'm 48)
DeleteWhat can I do to determine my LT1 ?
1 - treadmill but with bruce protocol for ergometer test (3% incline every 3 minutes) ?
2 - trust the bike readings of DFA a1=0.75 ? (seems too high for me)
3 - non of the above, just run with the talk test ?
I understand that there are a lot of protocols for treadmill tests for athletes: Bruce, Ellestad, Balke, each one with thei own modifications.
DeleteTo avoid early DFA a1 decline, what would be a treadmill protocol suited to get true readings ?
See my comments in the other post about why the run measurement may be an issue. Try either an elliptical, stair stepper or bike to get the HR at a1 = .75. If the bike seems too high, do it a couple more times to confirm. Lastly, some people may simply not get perfect agreement.
DeleteI already saw it, and for me it is mandatory to find hte correct AeT
DeleteI will follow your protocol on bike one again using Zwift and Elite
Could beta blockers be an issue ?
Let me know how you do. Beta blockers are probably not the issue, I originally did a case report on/off Atenalol to see if a1 behavior changed (it did not). Some unpublished data also suggests that they are not a factor.
DeleteI just tried another little test. I did a walking 4 min HR ramp up a hill. The data looks like it agrees with bike/elliptical data. I need to find a steeper and longer hill to try and get to a1 = 0.75 as I couldnt get HR high enough. Looks like it could be another option for anyone who has incongruous running data and may not have access to other equipment.
DeleteGood idea, thanks for the feedback
Deletespookymuggs, I did quite the same as you: treadmill, fixed speed at 5.5km/h, incline at 0.5% to start, then +0.5% every 6 minutes. DFA went down to 0.80 but then rose up again after 75 minutes with a 8.5% incline and I stopped
DeleteThis comment has been removed by the author.
ReplyDeleteI was trying to investigate a bit further and found there are a couple of apps that connect to the H10 and give an ecg trace. I wondered if they would give any useful information if I tried to capture when running? I have uploaded a screen recording in the dropbox folder above. Let me know if you think it could be useful or not.
ReplyDeleteNow that's cool! Although exciting, I looked at a related app specs, and the sample rate is only 130 Hz - way too low for wavefrom analysis (need at least double that, 500 Hz is even better). If you are worried about an arrhythmia it seems useful, but then you need to be trained to read a rhythm strip. I am going to look at it further - thanks again. Will report back.
DeleteThis comment has been removed by the author.
DeleteHi, together.
DeleteSince quite a bit I am developing an Triathlon Training APP and I want to implement the DFA-a1 analysing method with my team for practical use as I see all the benefits of practical usage as you are describing them.
I wanted to test this quite new threshold detection method before being sure to implement it in a practical way, I have to say that I am stumbling over multiple problems that are described here. But I cannot beliefe that this might be the end of this journey.
So I started to read and studying all your findings and some podcasts from the last months and years of you Bruce and I am trying to find the reason for this strange situation I am facing because somehow the pitfalls do not fit together and are not aligned as what I understand from what you are explaining in all the blogs here. (read detail below)
This last comment made me now writing this comment to you, because my next attempt would have been to trace my ECG with the ECGRecorder APP running on the iphone. It would only scan with 130Hz but would be meaningless, if you say that I might face problems not with the sensor but rather would have biological problems with my heart, that only can be investigated with an APP running on a higher frequence. (Info: I am in contact with the developer of this tracer APP and asked if that could be changed.)
Details to my case:
I am experiencing exactly the same problems as reported here by 'spookymuggs' and 'Ruva'. Much too high values of 'a1' for biking for my understanding (male, 46, not very fit, a1=0.75=155bpm=210Watt), the cross trainer workout (elliptical) does not even drop below 0.75 (like with spookymuggs) with HR=146 bpm. I did the ellipical workout after I have seen my run data and I guess I am one of the guys with a 'runner syndrom' (drop of a1 when starting running) with the results being all over the place when it comes to a1=0.75 (125-150 bmp). Why bike results are higher then for runs is also a mystery as my artifact number is always below 1% having a H10 HRM. Should it not be just the opposite - bike HR should be a bit lower then the run HR?
I moved the sensor already an 1 inch or so to the left as described in another blog of you Bruce, and I also used compresse clothing etc. but the results seem not to be better. I am analysing the data with AIEndurance, Runalyze and I am even in contact with the developers there. Would you still recommend their algorithm even for APC problems if I would have such? I exactly have those APC drops sometimes like described by you and that is why I wanted to go down the road with the ECG tracer data.
Haven written all the above I am also wondering if there is an update in that area about 'recording ECG signal with 130Hz' in detail to make sure that I do not suffer from any biological problems that make my a1 values and therefor me as a tester useless.
Food for thoughts - Have you ever investigated in electrostatic charging due to sport cloth that might influence the HRM signal?
Happy to hear or read from you.
Regards
Phil
Another thing I would be interested in to exclude this as a problem.
DeleteIf the R-R Peaks are clear and strong (high R-peaks and little S-Peaks achieved to sensor displacement of 1 inch) then the a1 values should be fine and correct (= artifcat 0%) - am I right?
Or would additional noise between the R-R Peaks (maybe due to Heart valve defect 2 instead of 3) influence the a1 value but the artifact number would be still 0% due to the good R-peaks.
Thanks for your comments and thoughts, let’s go over the list:
DeleteIt would only scan with 130Hz but would be meaningless – Not so – we will get the waveform shape (maybe you have some sort of conduction issue or bundle block) and Kubios usually does quite well with the 130 Hz sample rate in my experience (I've learned a lot since I stated 130 Hz is too low). The app developer can’t help you – the 130 Hz is locked by the device.
Much too high values of 'a1' for biking for my understanding (male, 46, not very fit, a1=0.75=155bpm=210Watt) – There are folks who (for some reason) do not drop early. We are seeing that in more and more tests, and the HR differential can be 20 bpm. Having said that, it does not appear that the HRVT2 is affected in the same way (a1 of 0.5). I would suggest using a modified RPE/talk test to confirm or refute the 0.75 threshold – if you can hold a conversation at 155 bpm, the HRVT is close, but it could be much lower. As far as the drop with running, we still have little in the way of a reason why that happens, except for the change in cardiac vector from bounce screwing us the R timing.
would additional noise between the R-R Peaks (maybe due to Heart valve defect 2 instead of 3) influence the a1 value but the artifact number would be still 0% due to the good R-peaks. – Yes, exactly. You may have no artifact (either noise or arrythmia) but a conduction defect from whatever reason can mess up the RR timing. But, that usually presents as a premature a1 drop (not a late one). I would be happy to take a look at a ramp done with the H10 and ECG logger – just send me a link (use my email address from any of the papers).
Bottom line – looking at the ECG is priceless for cases that are difficult to figure out.
This is really interesting research. I've tried multiple straps and apps (Kubios & KRV Logger) but it's very challenging to get my a1 below 1.0
ReplyDeleteI got it below 1 during a very tough Vo2 interval session. But Tempo power seems to be around 1.4 for me. Do you think some folks might have a different metric? (I've used a Polar & Garmin strap)
Which Polar are you using, and are you using bluetooth for the recording?
ReplyDeleteI've used both Polar H10 & Garmin HRM-Duel, both via Bluetooth for sure - with HRV Logger.
DeleteIt might have used Ant+ for the analysis I did in Kubios - that was recorded via a Garmin Watch (paired with the Strap). Not sure what the Garmin watch uses.
You need to delete the ant+ hrm in Garmin settings and re pair as bluetooth only. Record a ramp to almost max, send me the fit file and I'll be happy to review it with you. Please use the H10.
DeleteThanks! I'll give that a shot this week and put on dropbox.
DeleteLooks like my watch (Fenix 3) only supports Ant for the HR strap. Would recording via the HRV Logger be OK?
DeleteYes, the HRV logger is fine. Use the workout mode for artifact correction, 2 min windows and you should be good.
DeleteThink I'm there now. I did 4 min steps and increased 10w each step. FTP is about 200, max HR is around 190. I was a bit nervous so HR felt a tad high at the start, then was about right when I hit 200w. I've included the HRV Logger detail as well as the Zwift FIT file with power data & HR.
Deletehttps://www.dropbox.com/s/0n7mf5cmdk020tu/HRV_data_010421.zip?dl=0
If I had to guess based on breathing I would say LT1 is around 140w, but interested in what you think! Thanks again for looking at this data.
See my latest post for details - I get much higher than your numbers.
DeleteWow, thanks. Appreciate that. Very interesting
DeleteThis could well be a dumb question as am getting out of my depth.... but I looked at this data in kubios (free) as I am still trying to get my head around all this. When the data is divided into the 4 minute ramps, around ramp 6, the poincare plot starts to show strong linear patterns that get more distinct as the ramps increase. I havent noticed this type of thing before and wondered if it had any significance?
DeleteI know what you are describing - I'm not sure what it represents, but I see that commonly. It could be a restricted set of values, so they are segregated together.
DeleteNice blog, I am digging deep into it and awesome work! I have been using a polar H10 for months by now and recently found out about DFA. I went looking into past running/cycling workouts in the runalyze platform but I found out that most of the recordings have a lot of artifacts and hence are not reliable. I always used a BLE connection on my Fenix watch. What could the problem be? A faulty strap? Or am I not positioning the strap properly on my chest (although HR readings never gave me issues apparently, except for running where at times where it loses the signal, but it happened only in the last month)?
ReplyDeleteYour best bet is to use one of the iOS or android apps that will record an ECG from the H10 - that way we can see if it's noise or an arrhythmia. http://www.muscleoxygentraining.com/2021/03/polar-h10-ecg-tracing-short-how-to-guide.html You could also use Fatmaxxer as that will capture the artifacts as ECG snips as well. After you do that, I would be glad to take a look for you
DeleteWill try and see thanks.
DeleteGreat work,
ReplyDeleteI got interested in DFA analysis, So I bought a polar H10. and did a quick test using BLE connection with my garmin (DFA was also real-time viewed with fatmaxxer). My known FTP is 168 watts, so assuming my LT1 to be somewhere around 120, after 5 minute warmup, I did a quick ramp from 90 -> 140 watts over 10 minutes (5 watts/min). I cut the warmup part and results were sent to runalze. my DFA remained over 1.0 over the entire session, going nowhere near 0.75... (it was also seen with fatmaxxer as well...)
I then did a full ramp (MAP test) trainerroad again gave me FTP of 168, my DFA went to 0.75 at 185watts/166HR, wich is even higher than FTP and hit 0.5 at 220watts/188HR, almost near my failure point (230 watts)
The real time DFA values looked similar on fatmaxxer.
The results clearly are off... the DFA alpha 1 values seen to be calculated too high for me. I had a though on this, and possible causes could be.
1. My difference from study population made the bias?
- study done only in caucasian population? I am asian.
- study done only in trained athletes? I am a recreational rider with around 5~8 Hr/wk training
- my minor arrhythmia (1st degree av block)? although it does not need medical attention, the prolonged PR interval may have some influence in DFA?
2. Something wrong with my protocol
3. My polar H10 could be faulty? [ Though less likely, as it is new... and the HR values seem correct, and SDNN values are in line with my old garmin HRM (ant only), and Artifacts: 0,0% on the log and no artifact on fatmaxxer]
I would appreciateyour insights.
Thanks for your comments. There should be no issue with ethnicity, age or training status. I am curious about the AV block and/or QRS complex effects on the a1. Can you send me an ECG recording from the H10 - you can use either Polar equine or Polar sensor logger from the app store.
DeleteOK i'll get a log and get a ECG recording tonignt. How can I send you a file? I can't find any email address on this blog
DeleteA Dropbox link is fine.
Deletehttps://www.dropbox.com/t/uv1pkpk8fImNzNu8
Deleteincludes: ECG data created with Polar equine (resting), 10 minute steady ramp (LT1 determining), MAP test, and a low-intensity workout done today (with DFA values over 1 all the time)
I reviewed waveform and it's fine. I also plugged your ramp into kubios and the HRVT was about 160 bpm. Given your max HR at 195 bpm, that's not totally unreasonable. Using the SDNN nadir as a measure of HRVT, it also agrees with the a1 calculation. So by autonomic physiology standards your AeT is about 160 bpm. See the end of http://www.muscleoxygentraining.com/2021/04/quick-look-at-someones-ramp-data.html for the graphs.
DeleteThank you for your review.. although "power" wise it still doesn't seem to make sense, in tearms of aerobic HR threshold, I see the point and that it makes sense. I'll do some more review on this topic and see my DFA trand over more workouts.
DeleteVery interesting blog. Maybe I'm an outlier, but I measure my Lactate levels at the end of every workout which is on a stationary bike in "constant wattage" mode and usually lasts an hour. I'm trying to end up in a range of 1.5 to 2.0 mmol of lactate. There is some variance and I was looking at using fatmaxxer to help dial-in my workouts, but it doesn't seem to work for me.
ReplyDeleteDespite working out at a constant 165 watts (with about a 10 minute ramp up at the beginning), the DFAa1 ranges between 0.4 and 0.6 in one session, and 0.35 and 0.45 in the other session. From what I've read, this shouldn't be happening. I should be well above my lactate threshold according to my DFAa1, but my actual lacate readings were 1.5 to 1.8 mmol.
If I try to modify my workout and decrease power to get my DFAa1 to the 0.7 to 0.8 range, my lactate will be down near 1.0 mmol.
I'm using the Polar H10 connected via BLE and don't seem to have many artifacts.
My nighttime HRV per my gen3 Oura ring is in the single digit number of milliseconds (the gen2 ring had me at around 12 to 14ms avg HRV). Could it be that this DFA analysis doesn't really work for someone with such a small HRV or I have some other issue going on?
Hi Mike, sometimes the h10 needs to be rotated a bit to get an optimal signal. Can you share a link to the fatmaxxer .ECG file for me to see if that's an issue?
DeleteAlthough I have the app in Developer mode, I don't see any ecg files. I just see the rr, debug, and feature files of the last couple days. Do I need a later version than what's in the Google Play store?
DeleteYes, go to https://github.com/IanPeake/FatMaxxer/blob/main/app-debug.apk and hit the download button on the right side of the screen (you may need to remove the playstore version to install this apk). Or use the app mentioned here - http://www.muscleoxygentraining.com/2021/03/polar-h10-ecg-tracing-short-how-to-guide.html
DeleteI've had a bit of adventure today, so I'm going to post the details in case anyone else runs into the same issue. I also posted this in the fatmaxxer github comments.
DeleteI can't sideload apps because I use my phone for both personal and work use and work makes me install a mobile device management program that won't let me side load apps for security reasons. I have an old android tablet somewhere I could use if we can't make headway otherwise. Fortunately I've been using Polar Sensor Logger for my workouts for several months, so felt comfortable that I could do that--until I couldn't.
The polar sensor logger app wouldn't create or graph an ecg file either. It's Google Play page says it needs firmware version 3.0.35 or later. I noticed that I was on 2.1.9, but the Polar Beats app wasn't offering an update. After scrounging around on the internet, I found others with the same issue and apparently you have to also download and install the Polar Flow app and create an account and then the Flow app actually offers the update. I did all this and it offered two updates in a row and now I'm at version 3.1.1.
I immediately started fatmaxxer and saw it created an ecg file. I did this 2 or 3 times and saw 2 or 3 sets of logs including an ecg and figured my problem was solved. I went down on my bike to do a quick workout under load and capture an ecg file to reference here. Unfortunately, it didn't create one for that workout (so there is some residual ecg save issue). I was able to create an ecg file in the polar logger sensor app, or at least appear to. It will run for a bit and will say "waiting for ecg" and then after it started to display a number (some number of microvolts), it would run for 5 seconds more and hang up.
Ultimately, I got some ecg files from both apps, but not necessarily while working out. Trying to view the fatmaxxer apps in excel doesn't look quite right since their seem to be multiple readings for the same timestamps. I'll post some links here and hopefully something in here will make sense.
From fatmaxxer:
https://drive.google.com/file/d/1q1cLlDml0779La9tnMcuoASDeKynZPAN/view?usp=sharing
https://drive.google.com/file/d/1pl-4XKkfri6wGKYhWoukrzbOeV1eA4Il/view?usp=sharing
https://drive.google.com/file/d/1pPKdk50yL5DTfDQMgw2JI6GxVJ_YkPxL/view?usp=sharing
From Polar Sensor Logger:
https://drive.google.com/file/d/11P04qQSO5ZhJn7ul4ixr1hS6tm_QWLjo/view?usp=sharing
https://drive.google.com/file/d/11Gf5WkHB7muJQQpXKtOTLkIrSbHbIQ-6/view?usp=sharing
One of the fatmaxxer files looks like it starts out very large and then has an exponential decay to a steady state. I had one episode where I got several artifacts as soon as the session started, but then they stopped and got zero more after that.
Sorry you had to go through all that - whew! However we now have the answer from your efforts. The ECG is inverted, either from having the polar module upside down or having a non standard cardiac axis. I have a post on that with some examples - http://www.muscleoxygentraining.com/2021/08/dfa-a1-and-optimal-hrm-position.html. I'm going to update that post with your data once we get this settled (if you don't mind). Suggestions - first try inverting the module (Polar name upside down) and save a Fatmaxxer ECG file. Then, with it inverted, move it left 1 inch and record another Fatmaxxer ECG - send me both and we will pick the best one (highest R peak). For now I added your ECGs to http://www.muscleoxygentraining.com/2021/04/quick-look-at-someones-ramp-data.html (the last case).
DeleteI'm happy to have you post my data. Hopefully it helps someone else get this working too. This is huge deal. Thank-you for the help and all that you are doing with this DFAa1 concept.
DeleteHere is an ecg file from snapping the sensor into the strap upside down centered on my chest (fatmaxxer locked up after about a minute and a half):
https://drive.google.com/file/d/1sYUO4EGtNXxd3eW2jygdO71V61sXUoOM/view?usp=sharing
Here is a file after moving the sensor an inch to my left with the sensor still upside down:
https://drive.google.com/file/d/1sry7oGPE-1Elluo3_aZJ5ZWtSgnWwSBI/view?usp=sharing
Both inverted are similar but the centered is slightly better (?). Signal to noise ratio improved but try to use some conductive cream under the sensor pads (moisturizer works fine) for optimal signal strength.
DeleteI'll put the pictures in the same place as the first screenshots for you to see. Last piece of the experiment - do a ride under the same conditions as before (a ramp and/or power about 165w) - we will see if the numbers are better.
Thanks Bruce. I'm headed to the CES show in Las Vegas for the rest of the week. I'll try a workout when I get back to see what's changed. I've got conductive cream that I used to use with a different sensor a few years ago, although with these workouts I seem to be sweating enough and reading heart rate was never an issue with the H10. I guess we're trying to suss-out more information and need more signal instead of just heart rate now.
DeleteAfter drinking and eating too much, being jet-lagged, and probably being exposed to COVID during the previous 5 days, I was going to do a ramp test to check out wearing the Polar H10 inverted. I started 30 watts below my normal LT1 level of 165 watts. After 10 minutes at 135 watts, I was already at 2.1 mmol of lactate. My DFAa1 was .7, so even though my lactate shot up, this was encouraging as far as getting a useable signal goes. I added 10 watts to see where this would go and my lactate increased to 3.1, but so did my DFAa1 to 1.05. Added 10 more watts and my lactate rose slightly and DFAa1 rose higher. I then dropped back to 145 watts for the last 30 minutes and took a couple more lactate readings.
DeleteExcel with graph of HR and DFAa1 and including table showing time, wattage, HR (2 min avg), DFAa1 (2 min avg), and lactate: https://docs.google.com/spreadsheets/d/18OIQYmPpluLW4NTFdWmY-ifBP8EPxwhJ/edit?usp=sharing&ouid=103340134804964568090&rtpof=true&sd=true
features file: https://drive.google.com/file/d/1wCUSeZhrInw43F5PE4MoBA4nXCzQ6gLm/view?usp=sharing
ecg file: https://drive.google.com/file/d/1wP4Xwt_n5JNJQccAM_YIZ1XS4Z_UTkEF/view?usp=sharing
This morning, as I suspected, my lactate threshold improved with better sleep, no alcohol, and the workout yesterday. I warmed up for 15 min and made the ramps longer--9 minutes at power instead of 5 and measuring every 10 minutes (1 minute used measure lactate and record everything then change the power). I noticed yesterday I introduced artifacts while measuring lactate, so I changed the process and things settled down some. There was what I think was a PVC at about 45 minutes (I think I see it in segment 6). I had these about a year or two ago at rest, but they've largely gone away (with Mg and getting my thyroid under control). I've never felt one during exercise before--much more dramatic.
Excel showing data table and graph: https://docs.google.com/spreadsheets/d/18VV6F50j0RTSzLsWJ4EjRzVHksOCVLnB/edit?usp=sharing&ouid=103340134804964568090&rtpof=true&sd=true
features file: https://drive.google.com/file/d/1xe53oVyui7Fk9gHIeLyzBkXzfKgczo9e/view?usp=sharing
ecg file: https://drive.google.com/file/d/1xixj3weTWUp_yb9FwIv_JZKXBzU8qgaN/view?usp=sharing
I used conductive gel and with the H10 inverted, I'm definitely getting better signal. It seems like it's behaving better, but I'm not sure I can use this to fine tune my workouts. Today was a pretty good structured data set. The last 30 minutes of yesterday's workout and the last 15 minutes of today's were under constant load, but the DFAa1 seems to swing 0.40 over that time.
I'm 63 years old. Prior to the pandemic, I was doing HIIT on the bike at the health club for the previous 3 years or so and no aerobics. Then stopped doing anything for almost a year during the pandemic. Then got a bike for home and started doing what I think are your Zone 1 workouts ( Iñigo San Millán's Zone 2 in 5 zone model). I went from an LT1 of 110 watts on March 1st to 165 watts on August 1st where I've plateaued. I've had zero reduction in resting heart rate or HRV in that time. It's normally around 72 at rest during the day and my Oura says it gets to the low 60's at night. So my lactate responded as you would expect (4 hours or more a week). My heart, not so much.
Per your latest post, I think I'm definitely getting better signal with the H10 inverted, but I think I have some other issue going on with the HR and HRV. If there is discordance, do I train using lactate (which is a pain) to get better metabolically, or do I follow the DFAa1 and perhaps get better cardiac system benefits? Perhaps pushing harder to LT1 is going past where it's beneficial to my heart because it's more chaotic?
I somehow posted the wrong link for the first Excel file from 1/9/2022. It should be this one: https://docs.google.com/spreadsheets/d/18NS8LaLAPpAbcZlhsRco1nYO8gfTwN_T/edit?usp=sharing&ouid=103340134804964568090&rtpof=true&sd=true
ReplyDeleteHi Mike, I looked over your ECG files - the signal is better, no severe arrhythmia that I can see but you should use the newest fatmaxxer as this puts a marker between "snips" so it's easier to see whats happening. Signal is good, near 1000 uV. The first day back after your trip was interesting. The higher than normal a1 is from excess artifact correction (I added the screenshot to your case study), but the a1 is about .75 during clean parts. That is in keeping with the lactate about 2 mmol. You did get down to about .6 DFA a1 toward the end. The second session had fewer artifacts and a1 was between .5 and .8 (graph added on your case). HR was pretty stable except for that interval with lower a1 values. I would view this as a sign that your autonomic NS is still a bit "stressed" from everything you mentioned. At this point I would trust the a1 for thresholds once you return to well rested normal (since we optimized the waveform voltage). Remember - it's also used for indicating fatigue - if your numbers are unusually low. I'm about your age and I do 90% of my training in zone 1 (a1 >.9) and the rest HIT twice a week. Recovery gets harder each year. You want high volume, low intensity, if you can manage the time. We are learning that pushing hard efforts when your ANS is showing stress may not be optimal - so I go by a1 rather than lactate or muscle O2 breakpoints. When we were 20 years old, it may not have mattered much, but at our age, recovery is key. I did not see any VPCs, but if you spot anything, send them my way.
ReplyDeleteThanks Bruce. All other things being equal (other stressors are "normal"), do I need recovery from zone 1 training? Can I do it every day? I'm assuming I only need recovery from HIIT or an actual ride.
ReplyDeleteMy oura is always nagging me about HRV, but I figured I can still do zone 1 regardless. Should I take more days off?
Prior to lactate and now DFAa1, my best guess was Maffetone's range, but even that is a rubric. For me, that would be about 118 bpm and he would want me to take off 10 beats for being on daily meds. Using lactate, I make some pretty quick progress and my heart rate at LT1 was in the low 130's and during summer, even with a fan blowing on me it would get into the mid to upper 130's.
I tried to back off in yesterday's workout and keep DFAa1 higher. I ended up at 10 watts lower than my rested normal, but was only 1.0 mmol of lactate. Definitely easier. Am I going to lose conditioning this way, or will I facilitate batter recovery and ultimately a higher HRV and lower heart rate?
All good questions. Personal factors such as muscle fiber type, SNP variants, recovery ability all play a role. Even zone 1 volume can add to the "fatigue" load depending on your status. Your concerns mirror mine, and it's difficult to answer. Everything contributes to "load" including resistance exercise, long walks, extensive yard work etc so riding in zone 1 may not be too much depending. I would suggest taking 2-3 days off, no alcohol, plenty of sleep then do a baseline ramp to get some thresholds. See how that looks then begin some polarized training (even 95/5 easy/HIT) and follow the ramps every couple of weeks for progress. You will not lose conditioning by avoiding excess volume/intensity if you are careful. What you don't want is to over reach - you are better off on the other side of the spectrum (at our age). So keep the a1 above 1.0 on easy days and when you do your HIT, really blast it (but not too often). Hope this helps -
DeleteHi Bruce,
ReplyDeleteHas respiration rate been incorporated into the DFA a1 studies? It would seem like a good metric to narrow down the VT1 and VT2 window levels.
The Frontier X monitor measure respiration rate this but I cannot use with HRV logger since it does not send out RR signal.
https://fourthfrontier.com/pages/know-the-science
Frontier sighted the following white paper.
https://www.frontiersin.org/articles/10.3389/fphys.2017.00922/full
Thanks.
Resp rate data is now incorporated into kubios and appears pretty accurate. No, we have not looked at this in terms of a1. I am sorry but know nothing about that device.
ReplyDeleteWould that be kubios Premium or free.
DeleteThe Frontier x device records ECG 24/7 as a hear monitor strap. I asked the company to add RR Sending signal to be added to device in order to work with HRV Logger and other HRV apps
DeletePremium https://www.kubios.com/respiratory-rate-algorithm-validation/
DeleteLove this blog!
ReplyDeleteI'm struggling to figure out a ramp for myself for my cross trainer and bike. Would this result in an optimal identification of my aerobic zone? My max HR is 200bpm. I think my aerobic zone is 145-155bpm
Warm Up 10 mins @ 125bpm.
3 Mins @ 135bpm
3 Mins @ 145bpm
3 Mins @ 155bpm
3 Mins @ 160 bpm
3 Mins @ 165bpm
3 Mins @ 175bpm
What about when using it for real time adjustment on a real work out? Should you just do like:
4 mins at 140bpm
4 mins at 150bpm
4 mins at 160 bpm
4 mins at 170bpm
And see when I hit 0.75?
Many thanks!
Thank you. There are many ways to look for your first threshold and it's always difficult to say which is best. I'm assuming you do not have power (since you suggest HR). The second set of numbers seems reasonable for a ballpark look - and yes, when you reach .75, that's about the limit of zone 1. As I mentioned elsewhere, there can be some bounce in the numbers so repeating this a few times should give you some more accuracy. We have used HR as the sole measure in some of our studies, including this one that just came out (https://www.mdpi.com/1424-8220/23/4/1973/htm#) - good luck
DeleteHi Bruce,
ReplyDeleteScanning through the comments, am I right in deciphering that wearing the Polar H10 strap in the inverted position (letters downward) is the right way to capture the best signals for this HRV a1 analysis? What's the difference relative to the other way round? Have you written about this in greater detail elsewhere?
Ron
No, for best results look at the ECG first using Fatmaxxer or ECG logger and make sure the R wave has a strong positive voltage. Once you do that, it doesn't need to be repeated since your cardiac "axis" should not change. See http://www.muscleoxygentraining.com/2022/01/pitfalls-in-dfa-a1-polar-belt-position.html
Delete