Updated 2/7/22, 2/14/22, 2/22/22, 2/23/22, 4/11/22, 10/24/22
New readers who would like to learn more about DFA a1 during dynamic exercise please read the FAQ for background.
Updates to this post:
A little over a year ago an established HRV app (HRV Logger) was modified to display DFA a1 as part of it's feature set. Since that time, two websites (Runalyze, AIEndurance) and one Android app (Fatmaxxer) have advanced the a1 recording field further by essentially reverse engineering Kubios premium's feature of calculating a1 every 5-10s using the same preprocessing methods. In these three modalities, I've shown that a1 agreement with Kubios is quite close, reassuring us that the results will be relevant to conclusions drawn from published studies. The intent of this post is to do the same type of analysis and agreement comparisons with the new a1 data field for Garmin products, AlphaHRV.

Because of the severe processor, memory and programming limitations of a Garmin device, the method of data preprocessing is different than Kubios (and Fatmaxxer, Runalyze and AIEndurance) which means results may not match as well as hoped for. I've discussed before why preprocessing is so important and we saw how different results can be between the initial and final version of both Fatmaxxer and Runalyze. Here is an comment from a study by Voss et al., that is instructive:
In addition - the following was included in my post on Fatmaxxer regarding "detrending" -
Since
we are basing training thresholds on the value of DFA a1, precision is
of utmost importance. Other HRV indexes (SD1, SDNN) rely on looking for
a nadir during an exercise ramp for AeT determination. With a1, we use
a value - that's both a blessing and a curse. The blessing is that we
don't need a ramp to failure and could probably estimate from a mixed
exercise session. The curse of course is that we are relying on
accuracy of the HRM in getting the RR timing correct and the computation
methods of the software. The process of obtaining the a1 is complex.
The HRV software needs to first "detrend" the data. This has nothing to
do with "detrended fluctuation analysis", AKA "DFA". The detrending of
RR data is done to remove "stationaries".
These are slow changes in beat pattern from other causes. If they are
not removed properly, the DFA a1 will appear more "ordered" than it
should be and a bias upward will be seen at very low values (for example
a true a1 of .4 may appear as a .6 or higher). This has been the
bugaboo of some of the other software approaches including the initial
python related packages. For instance, Runalyze was somewhat inaccurate
before they enhanced their approach to using the "smoothness priors"
approach of Kubios. HRV logger does not use the "smoothness priors" of
Kubios fame method either. The issue is worse for recordings with more
stationaries of course - so YMMV. We saw very good accuracy with HRV
logger in the Frontiers study, but in my personal use, it is not there.
After a fair amount of work, Fatmaxxer has been significantly upgraded to use the Kubios method of "smoothness priors". Despite the calculation load, the speed is not affected even with a re-computation of every 5 secondsThe detrending method employed in the Alpha HRV app can be varied between 3 options - Kalman filter (normal or strong) and "MA". Although Kubios uses smoothness priors, the same development team did review the Kalman technique and their opinion was very favorable.
The current detrending method used by this app is based on a "Low pass FIR filter (Butterworth order 30) applied twice, forward and backwards".
In addition to the above, we also have the importance of artifact identification and correction. Even if everything is perfect in the preprocessing department, inadequate artifact removal can bias the a1. Although many readers just want to get to the bottom line on whether this app works - it's critical we understand that the data we rely upon for training decisions (the a1) may not be as valid as we think. Therefore, we have the following "hurdles" to jump to yield a1 values in line with Kubios:
- Preprocessing - detrending (moderate to high difficultly)
- Artifact recognition and correction (variable difficulty)
- The actual DFA calculation (not that difficult)
- Presentation, graphing and recalculation interval (dependent on the developer)
With this in mind, let's take a look at the app.
Protocol - indoor cycling, no formal ramp but gradually raised power by simply changing gears at steady cadence to past the AeT. This was the day after a hard session for me, so I knew the a1 would drop easily. I wore the Polar H10 (bluetooth to Fatmaxxer and Garmin) and the Movesense ECG for rhythm analysis. Bluetooth is recommended for avoiding artifacts at high HR but I decided to use Ant+ for the Garmin alpha 1 app.
Install - download, install, then go to the "activity" of interest (cycling, running etc), add a data screen and populate the data screen with a single connect IQ field, namely alpha HRV. Use the Garmin Express PC app to change the settings.
Settings:
For this test I used bluetooth.
However: If you were to use bluetooth, you must first make sure that the H10 is not paired with the Garmin device (if it is, delete the pairing). The app apparently has it's own RR acquisition mode and if the H10 is already paired to the watch, it will not work in bluetooth (but will in ant+). If you want to record RR to both your Garmin device for later analysis in Runalyze or AIendurance, use Ant+ to the app, use bluetooth to the Garmin device so as to be able to confirm results (after uploading to Runalyze or AIEndurance.) Note - the app requires it's own bluetooth channel and can't use the same HRM module as paired to the Garmin device. Therefore, to have bluetooth RR recordings to both the app and your Garmin unit, you must use 2 different H10s.
Edit 2/23/22
Potential game changer - it appears this app takes advantage of a higher Ant+ sample rate than the Garmin native device. The result being - no more rate related missed beat artifact. I have confirmed this in my own recording and another from a friend. At this point we can have the best of both worlds - Ant+ to the alphaHRV app, bluetooth to the watch and Fatmaxxer.
Next:
- RR series duration - The conventional method for the a1 "measurement window" is to use a time of 2 minutes worth of data. It turns out we need a certain minimum beat count, and a 2 min window gets us there. This app does not use a 2 min window, instead using a fixed beat count. This has been proven before to be valid and 200 beats is fine to use.
- It is important to note that the corresponding Kubios (or equivalent) value is not going to be identical simply based on a different span of beats. However, this method is fine IMO and was validated by Hautala et al:
Period of consecutive DFA analysis - I did cut down the re computation to every 10 seconds and will probably go even further down (every 20s) to save battery. If your device is an older one or slow, try 30 sec. This has been set (not user defined) to an every 5s recalculation (the same as in our published studies).
RR detrending method - as above, I chose the strong Kalman filter for the test below. We will need to do further tests to see which gets us closest to Kubios. No longer user controlled
The RR detrending calculations may still be in flux - see my Twitter (@bjrmd) for the latest comments.
Results:
Garmin Connect - the app does upload to your Connect IQ account, so the a1 is now on the data field list for the exercise session:
- Yes, very cool!
- There is a listing for artifacts as well.
Accuracy:
With the forewarning that this app is is an early development stage (and will get better) here is a comparison to Kubios premium with "automatic" artifact detection.
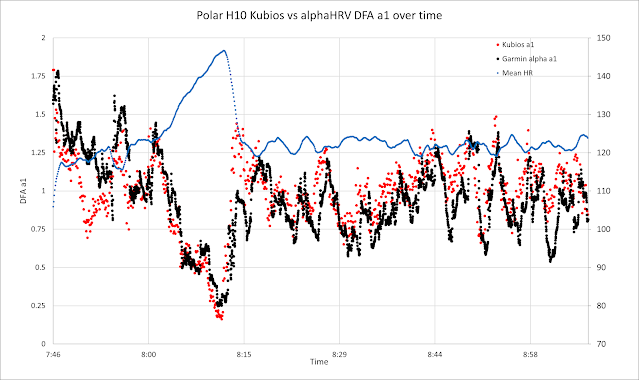
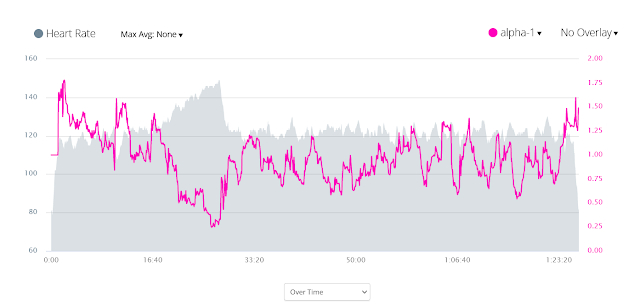
- What we see is that the black (Garmin alpha HRV) and the red (Kubios) track remarkably well. The a1 dynamic range on this session was from 1.75 to about .25 - wide enough to get a good idea if the app fell short in under or over estimating those critical values near .75 or .5.
- Recall that Kubios used 2 minute window measurements (so 140bpm x 2 min = 280 beats) vs alpha HRV used 200 beat windows - the data points are not going to be identical. But are they close enough for meaningful conclusions?
What about artifact correction?
- Artifacts now show in Garmin connect!
Kubios comparison:
- The high artifacts after the ramp were all APCs - alpha HRV had no difficulty in identification or correction. 13% vs 15% based on beat count vs 2 min window - near identical.
- Successful implementation of artifact correction - check!
Zoomed view of the "ramp"
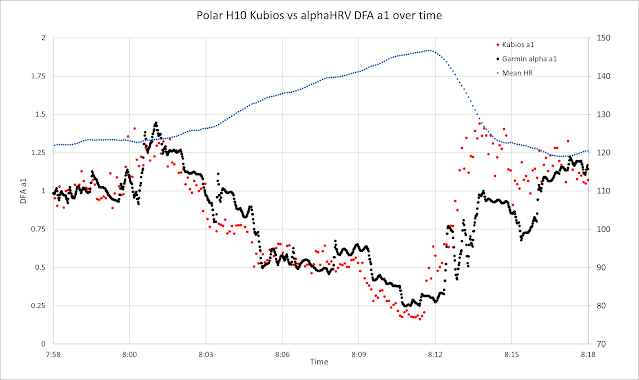
- The ramp data agreement looks quite solid!
- This is an amazing achievement considering the limitations on a Garmin device!
- Remember that Kubios is using 2 min windows and the alpha HRV app is using 200 beat windows - so they should not synch exactly.
- That said, this is certainly "clinically" useful. I would have confidence that I was staying in zone 1 of 3 (or 2 of 5) with a1 values above .75.
- For most precise threshold determination, I would still recommend Runalyze or AIEndurance if available. These options are closest to published a1 verification studies that used Kubios HRV software.
Added 2/23/22
A friends ramp plus cycling session using Ant+ for the alpha app, bluetooth to the Garmin device for analysis into Kubios
- There were no appreciable artifacts seen with Ant+, agreeing with my experience above - the alphaHRV app has a higher Ant+ sample rate than the Garmin device
Update 4/11/22It's been awhile since the last head to head test with Kubios and I thought another look could be interesting.
This was a 2 hour session combining a brief ramp, 20 minutes just below the AeT (20w less than LT1) and 2 Wingate 30s near max intervals later on (all indoors). Artifacts below 5%, Polar H10 recording, Kubios software vs alphaHRV.
Zoomed view of the 20 minute stable zone 2 of 5 (high zone 1 of 3):- Really impressive matching with Kubios despite the difference in window length (2 minutes vs 200 beats) and different detrending methodology.
- Certainly would be of use for proper zone enforcement for low-moderate intensity days.
Update 10/23 - key new findings:
Conclusion:
- Hats off to the developers for making the first DFA a1 native data field for Garmin devices (you guys should be proud). This brings DFA a1 monitoring during dynamic exercise for intensity assessment, training management, zone identification, readiness and durability to a large portion of Garmin users.
- Initial test results are very promising and further exploration is certainly needed. The Detrending method is different than Kubios, but appears to capture the data value direction and range.
- The Ant+ transmission difficulty appears to be Garmin software specific - alternate Ant+ acquisition using max sample rate allowed gives excellent results. My recommendation is to use Ant+ to the alphaHRV app and bluetooth to Garmin.
- Clinically meaningful decisions about thresholds, readiness and durability/fatigue appear to be possible with this app.
Heart rate variability during dynamic exercise